|
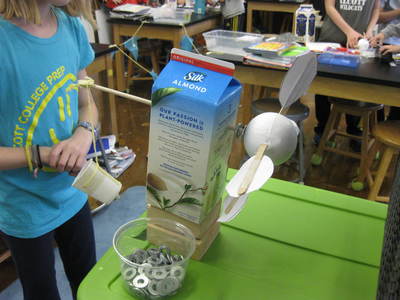
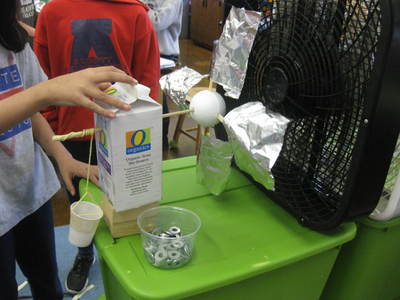
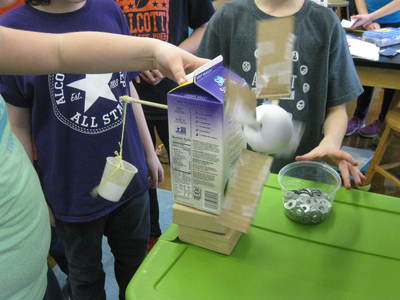
In honor of National Engineers Week, fifth graders used the engineering design process to design the most affordable windmill that could lift the most weight. As a part of our data unit, they were examining the relationship between cost and efficiency, quickly learning that there was no relationship between the two variables. What's this mean? That both cheap and expensive designs could lift both low and high numbers of washers.
Great work engineers (and mathematicians)! |
|
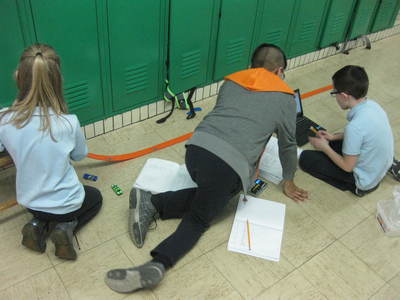
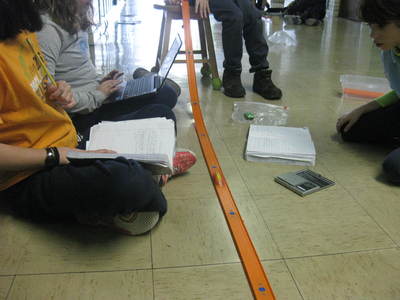
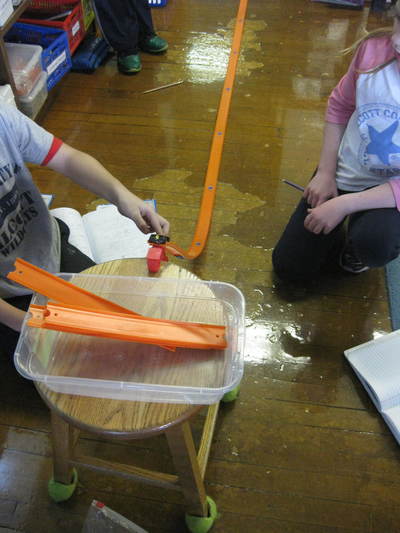
Fifth graders are seeing how they can collect new types of data based on different amounts of potential and kinetic energy! Between changing the ramp height and the mass of a car, students collected distance and time data to see the relationship between a car's potential and kinetic energy! Way to go 5th grade!
Fifth graders have collected an array of data in the scientific world and analyzed it. We're moving on to another important way in which data can be collected and analyzed...through energy!
We kicked off our study of energy by looking at two simulations. They've given students an understanding of both potential and kinetic energy and their various forms. They've also given students an understanding of how energy can transform from one form to another!
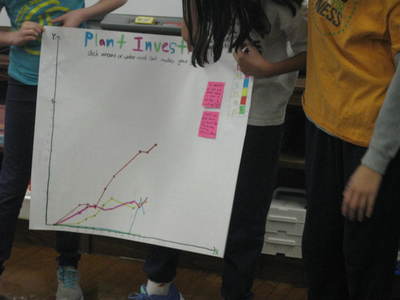
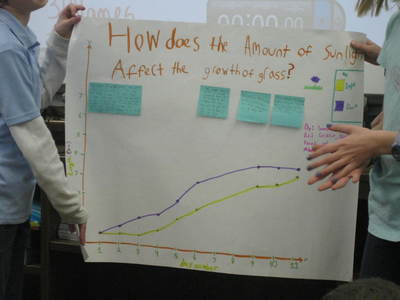
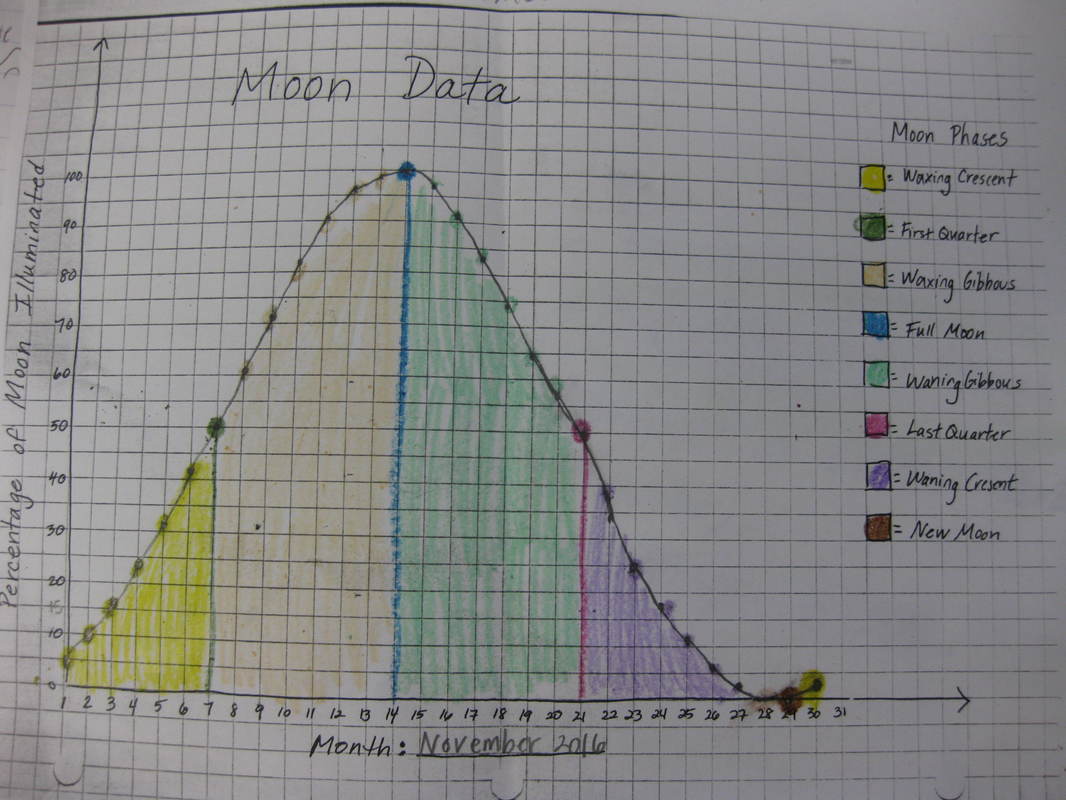
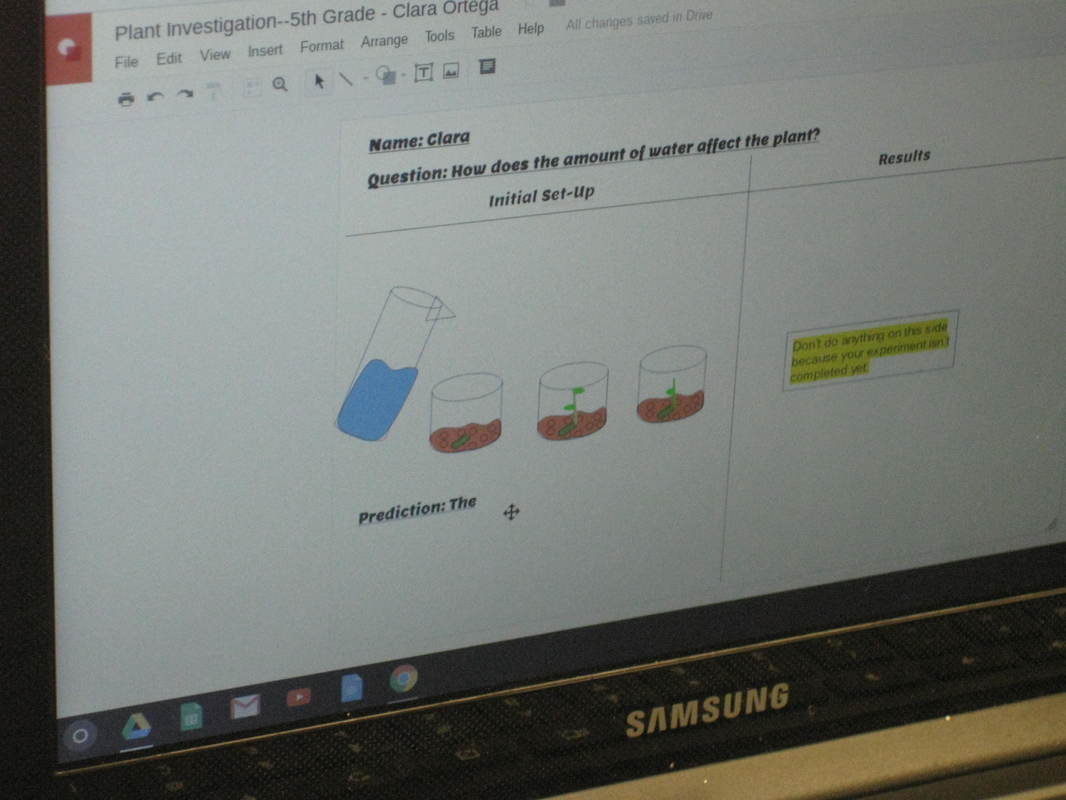
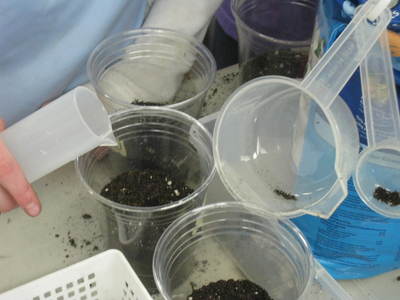
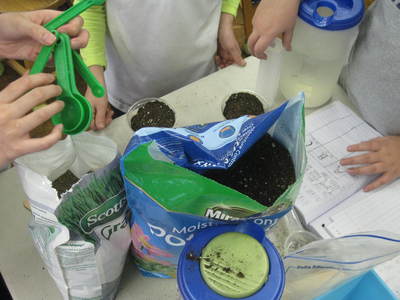
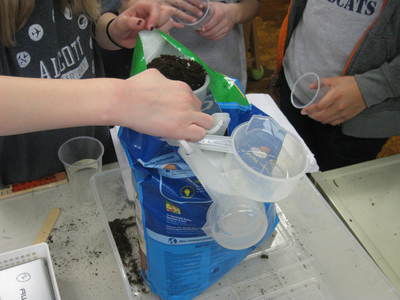
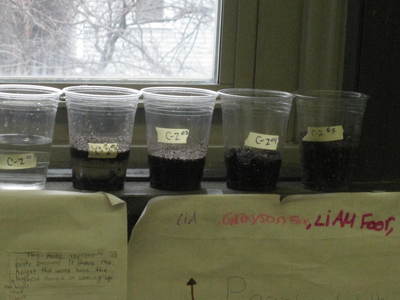
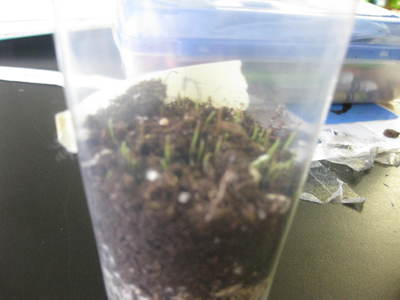
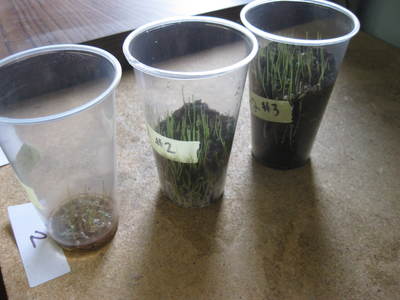
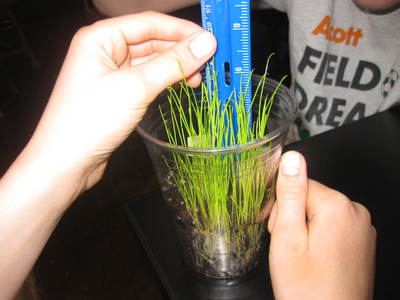
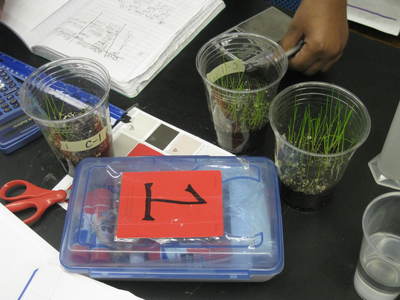
How does the position of the moon in relation to the Earth determine how much we see of it? How can we create a graphical representation of this to model what happens? And how can we make predictions for when we will see specific moon phases based on patterns in the mathematical models? Check back soon...we shall see! We continue to gather plant data on our grass seeds...so check out the post below! Students saw a repeating pattern as the amount of the moon illuminated decreased and then increased. They could determine when the next approximate full moon would be, as well as the next new moon.
"So that's how we could know when the next full moon would be even though that day hadn't happened yet!!!" YES!
One week in... Now that we can look at data with a more critical eye, we're starting to see how collecting and interpreting data can help tell a story.
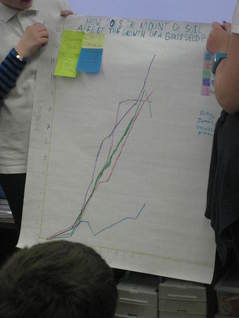
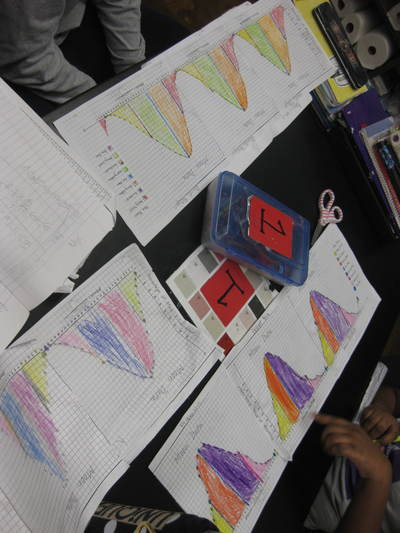
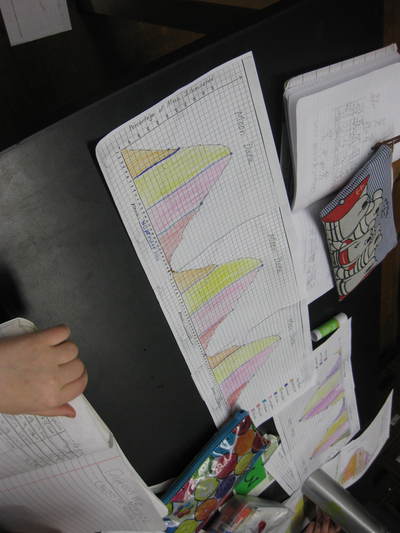
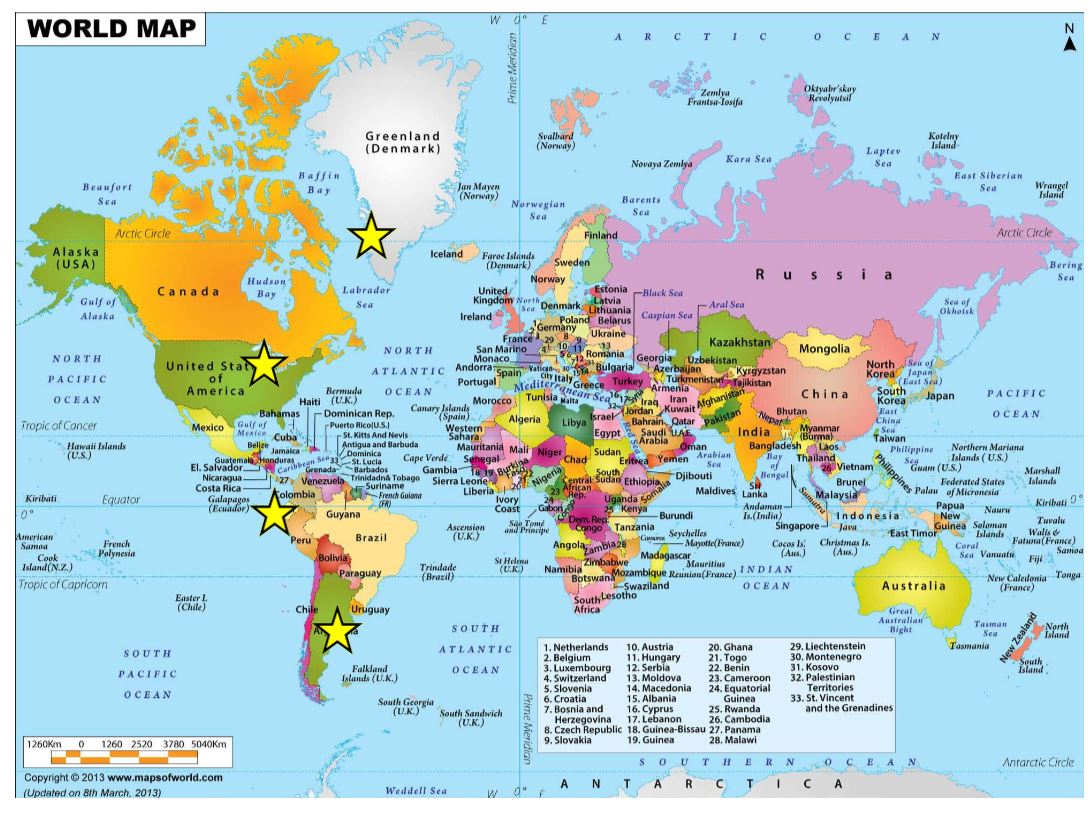
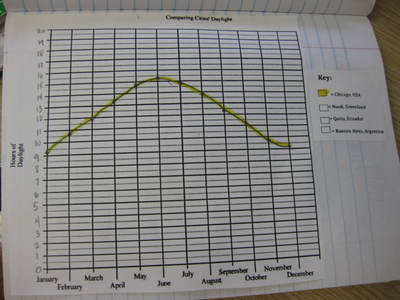
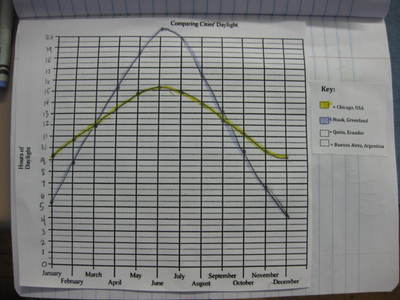
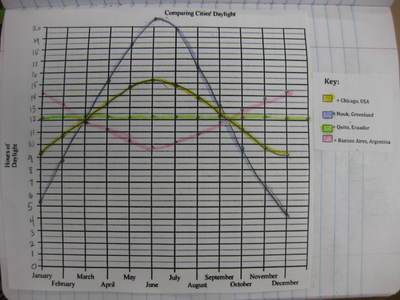
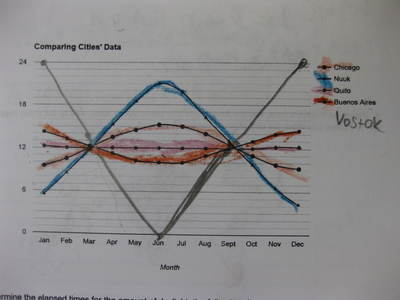
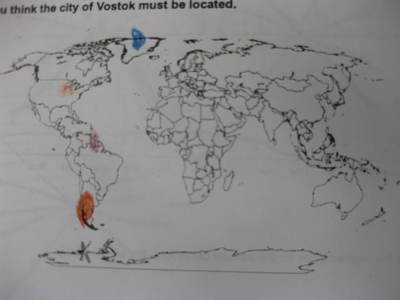
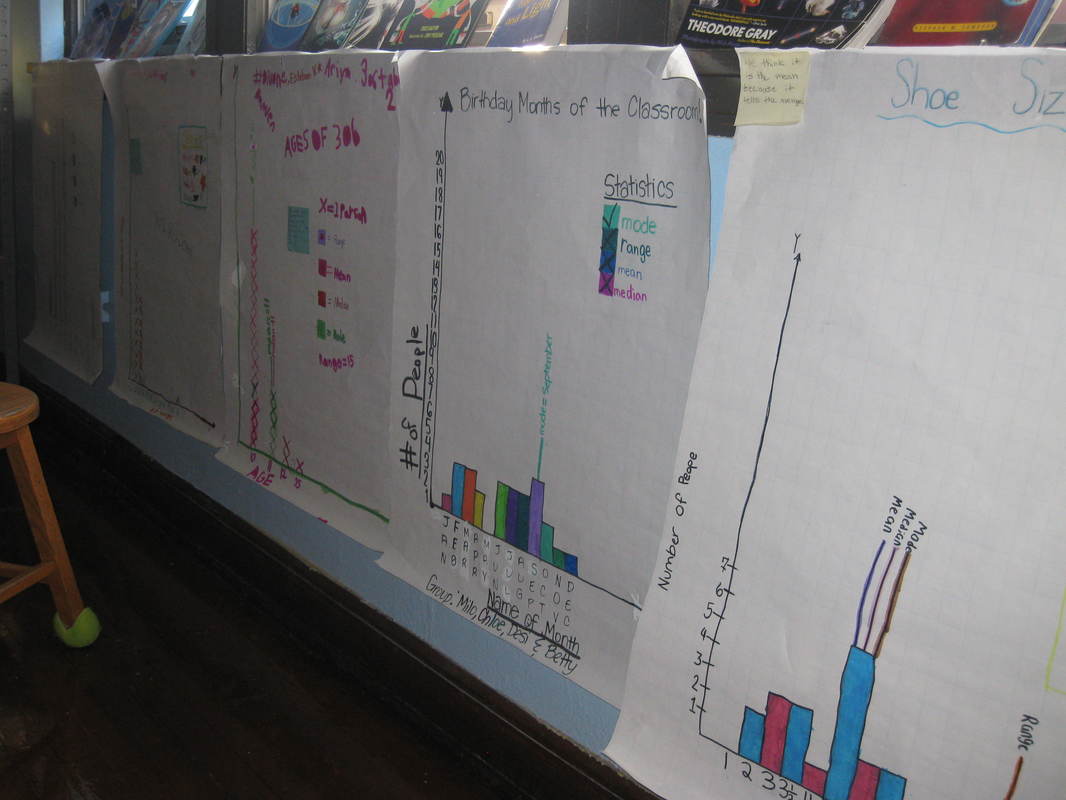
Using sunrise and sunset data, fifth graders are determining the amount of elapsed time between when a city on Earth first faces the sun (sunrise) and when that same location no longer sees the sun because it's turned away from it (sunset). Using the elapsed time data, students are graphing them to see what this looks like at four different cities over the Earth, all of which have a different latitude (Chicago, USA; Nuuk, Greenland; Quito, Ecuador; and Buenos Aires, Argentina. Check back soon as we look to uncover trends in the data! After organizing the data, students had to work in teams to display it and analyze it. Then after finding the mean, median and mode of the data (if they were able to!), students had to determine which statistic best represented the data.
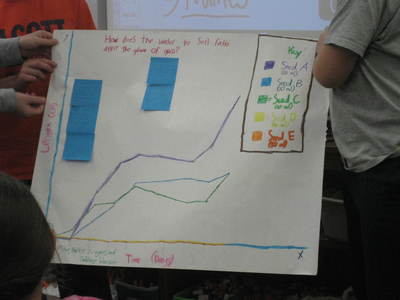
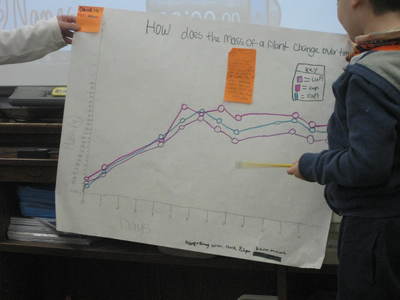
We had some INTENSE but meaningful discussions in class, and surprisingly, the mean wasn't always the best way to show what was typical of the class. We'll be uncovering how scientists can use these statistics in their data collection as they work to answer questions. Keep up the great work 5th grade! Working like scientists, fifth graders are taking data they collected and are working to organize it, display it graphically how they can best represent it, and then analyze it! It's incredible to see how their thinking evolves as they uncover more about data analysis!
Scientists collect and analyze data all the time in their work. But how do they go about collecting them? How do they decide what type of data to collect? How does the data they collect answer questions they're trying to answer or problems they're trying to solve? What story do the data tell?
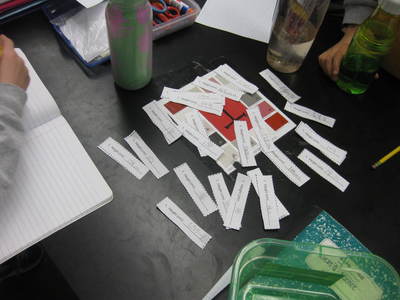
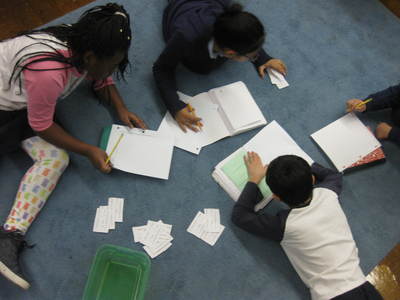
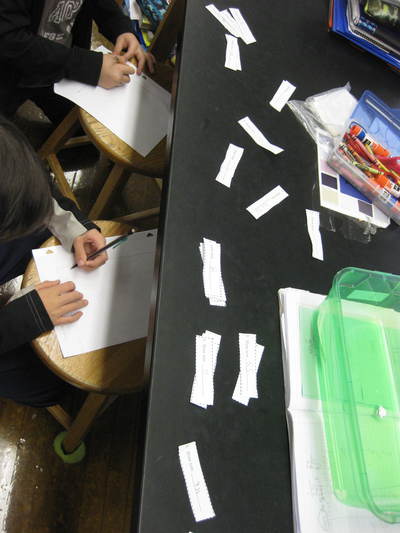
Fifth graders will be focusing on the following practices in their data unit: 1. Analyzing and Interpreting Data 2. Using Mathematics and Computational Thinking To kick off the unit, fifth graders are collecting data on themselves and their classmates, organizing the data, displaying it, and telling stories about it. Check back soon to see their work! |
DataCan be... Archives
March 2017
Categories |
 RSS Feed