Now that we can look at data with a more critical eye, we're starting to see how collecting and interpreting data can help tell a story.
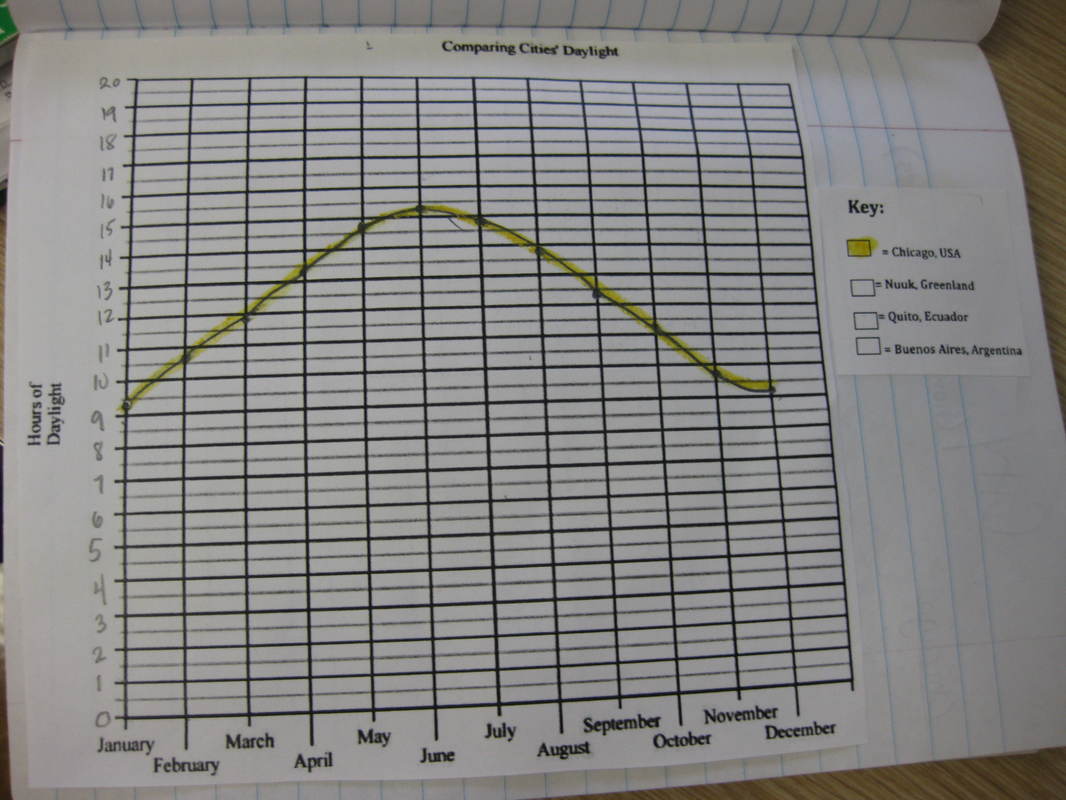
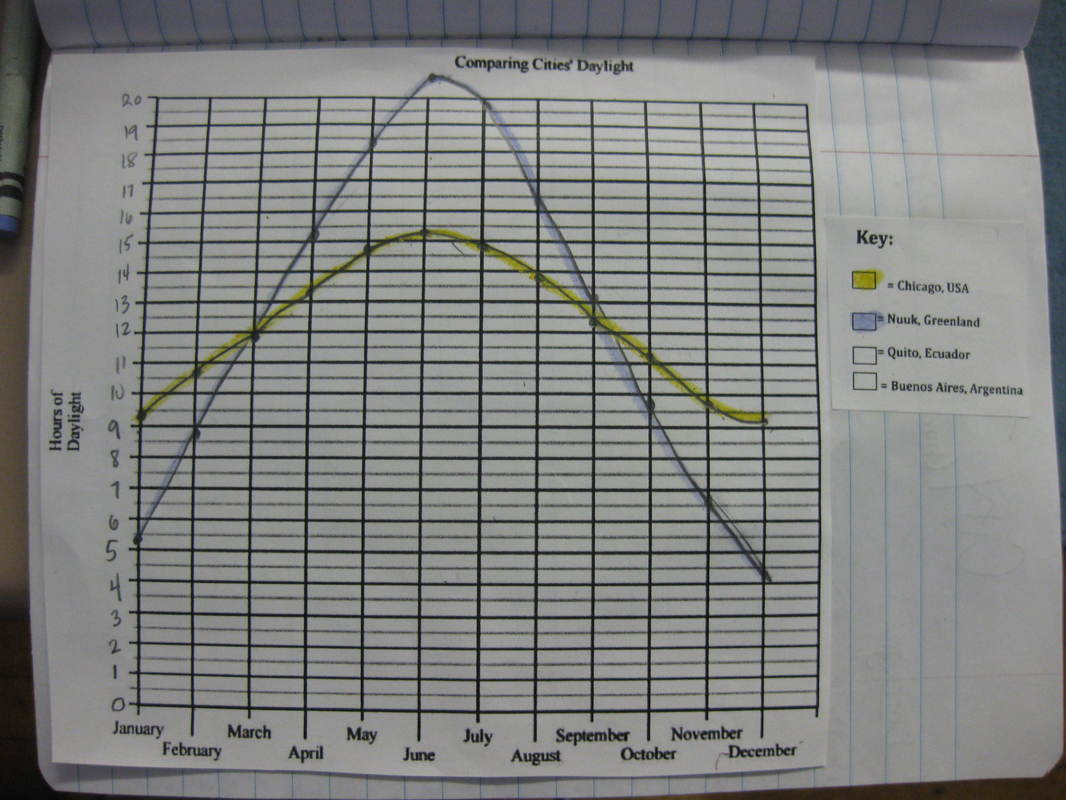
Using sunrise and sunset data, fifth graders are determining the amount of elapsed time between when a city on Earth first faces the sun (sunrise) and when that same location no longer sees the sun because it's turned away from it (sunset).
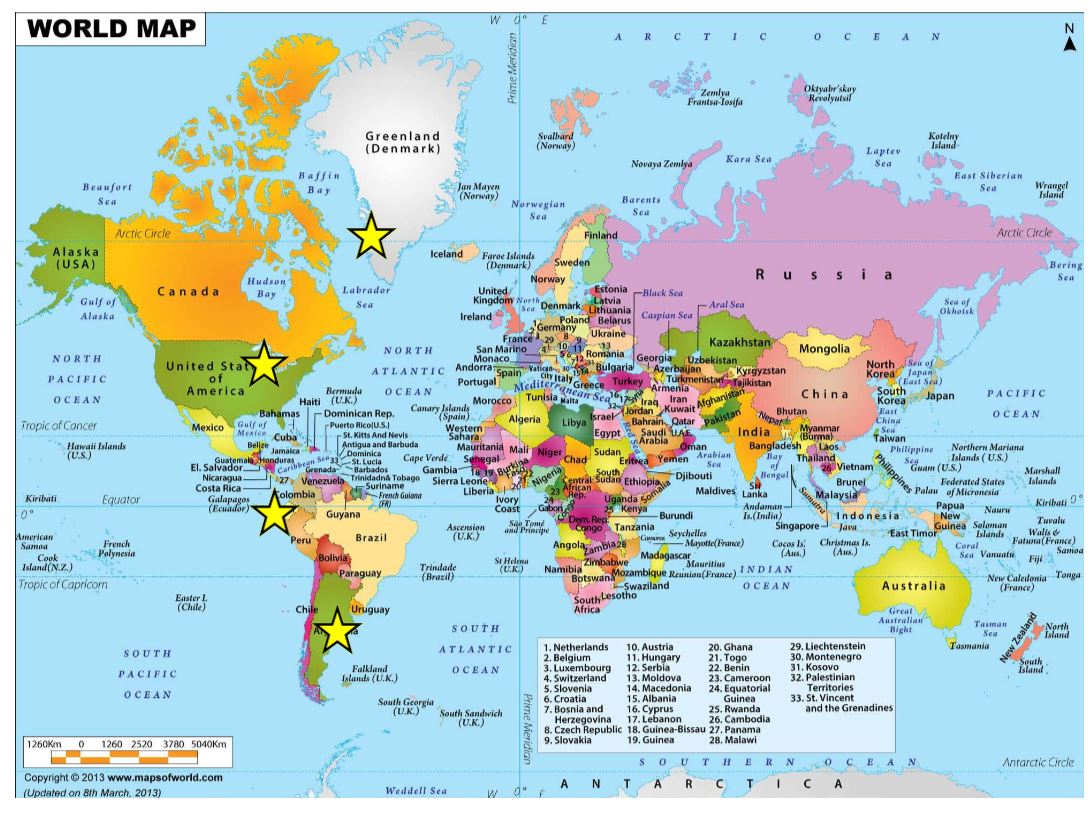
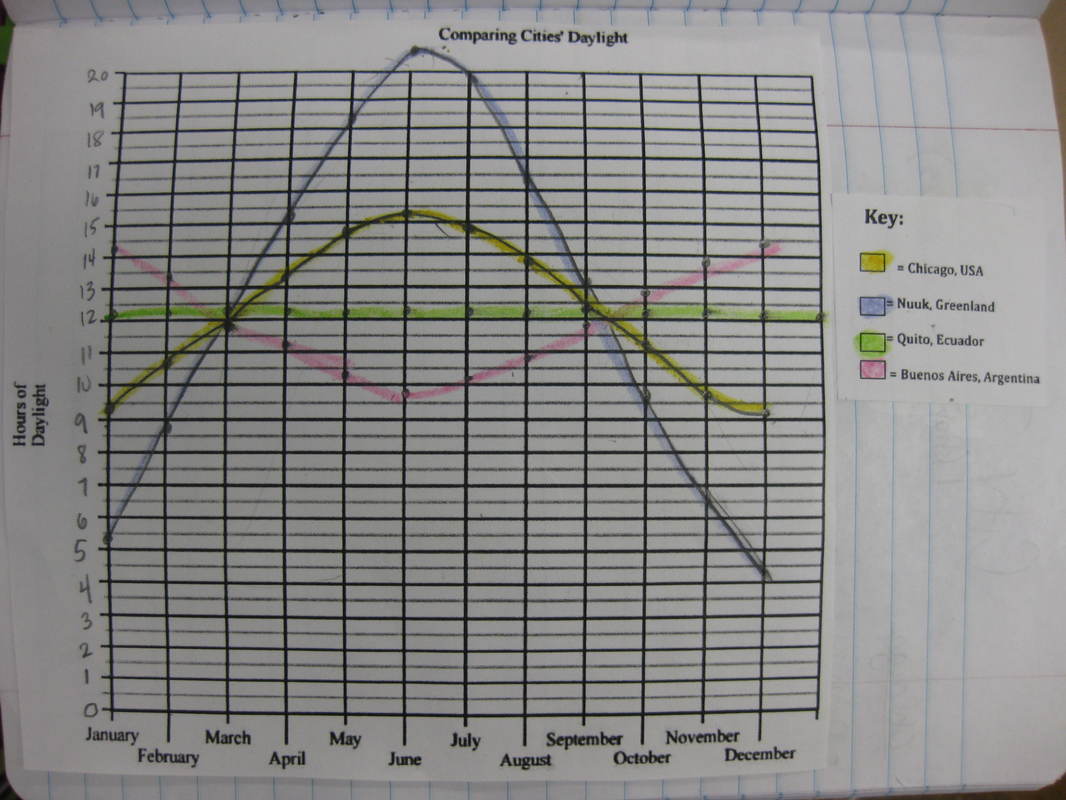
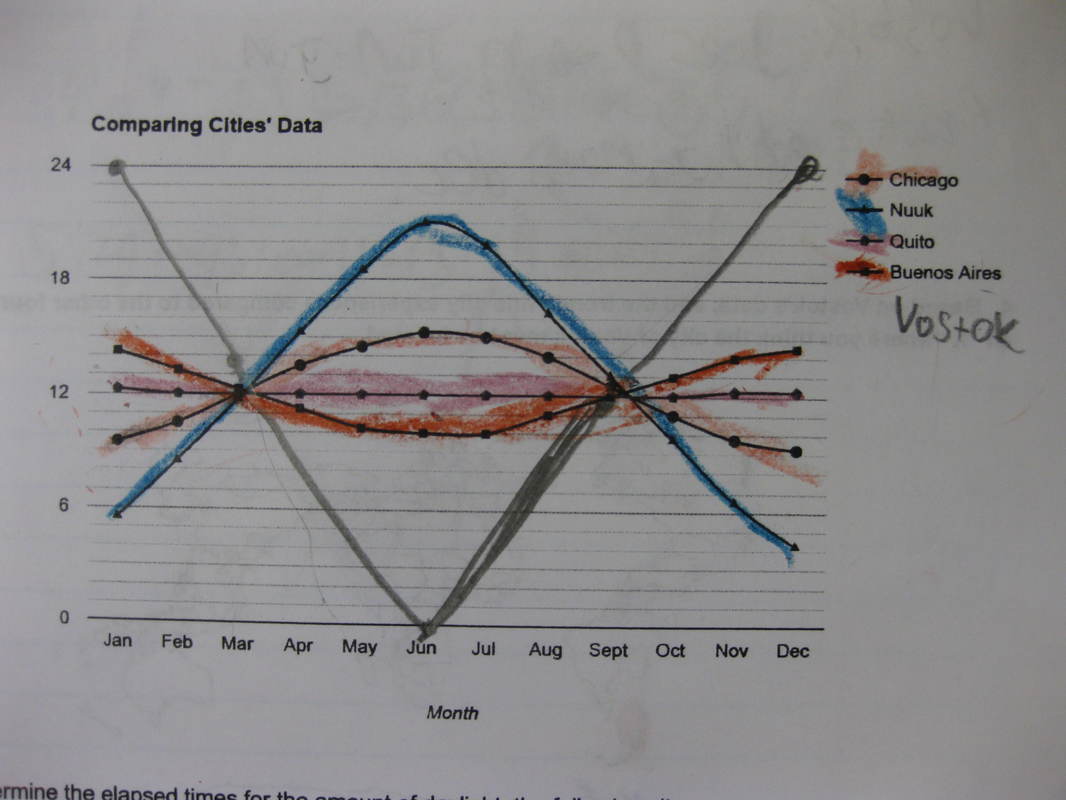
Using the elapsed time data, students are graphing them to see what this looks like at four different cities over the Earth, all of which have a different latitude (Chicago, USA; Nuuk, Greenland; Quito, Ecuador; and Buenos Aires, Argentina. Check back soon as we look to uncover trends in the data!
Using sunrise and sunset data, fifth graders are determining the amount of elapsed time between when a city on Earth first faces the sun (sunrise) and when that same location no longer sees the sun because it's turned away from it (sunset).
Using the elapsed time data, students are graphing them to see what this looks like at four different cities over the Earth, all of which have a different latitude (Chicago, USA; Nuuk, Greenland; Quito, Ecuador; and Buenos Aires, Argentina. Check back soon as we look to uncover trends in the data!

 RSS Feed