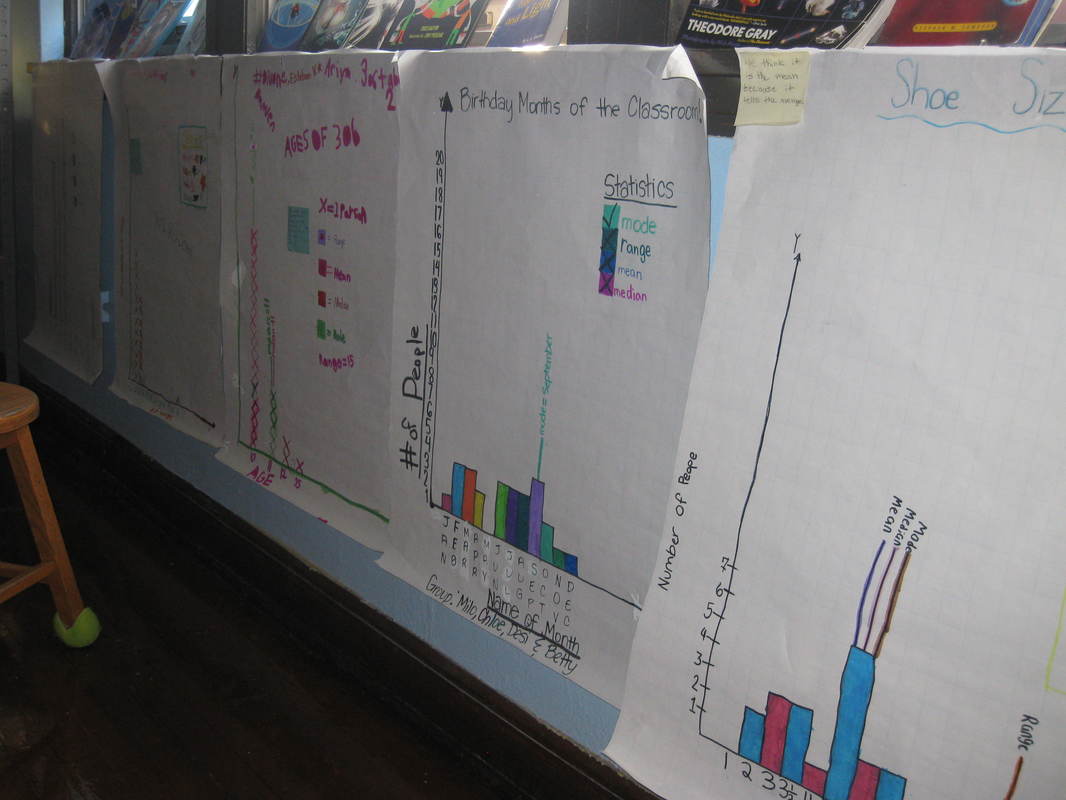
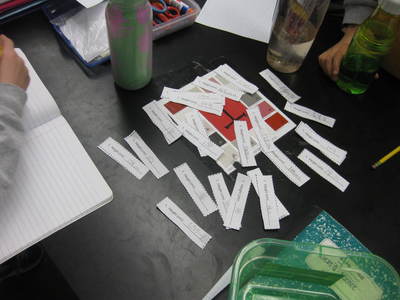
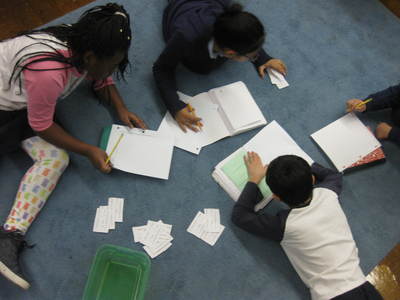
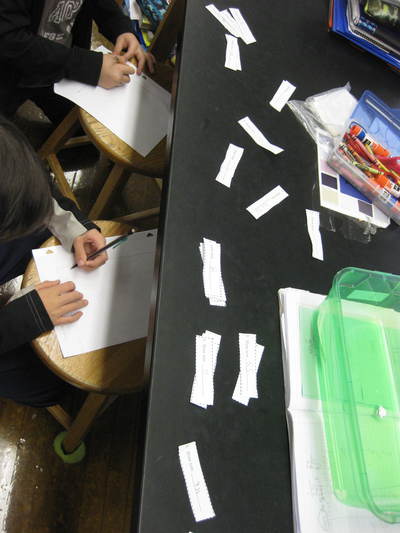
After organizing the data, students had to work in teams to display it and analyze it. Then after finding the mean, median and mode of the data (if they were able to!), students had to determine which statistic best represented the data.
We had some INTENSE but meaningful discussions in class, and surprisingly, the mean wasn't always the best way to show what was typical of the class. We'll be uncovering how scientists can use these statistics in their data collection as they work to answer questions. Keep up the great work 5th grade!
We had some INTENSE but meaningful discussions in class, and surprisingly, the mean wasn't always the best way to show what was typical of the class. We'll be uncovering how scientists can use these statistics in their data collection as they work to answer questions. Keep up the great work 5th grade!


 RSS Feed