 | In our Technology Integration class, 5th graders are beginning to explore infographics, a unique way to show data through technology. We'll be using "Piktochart" as a way to explore this medium of displaying data. Students will be able to represent any of the data they've collected thus far, which can include: 1. Moon Data 2. Sunlight Data 3. Temperature Data 4. Water Data 5. Chemical Tests Data 6. Class Height Data They'll be adding these infographics to their websites! |
|
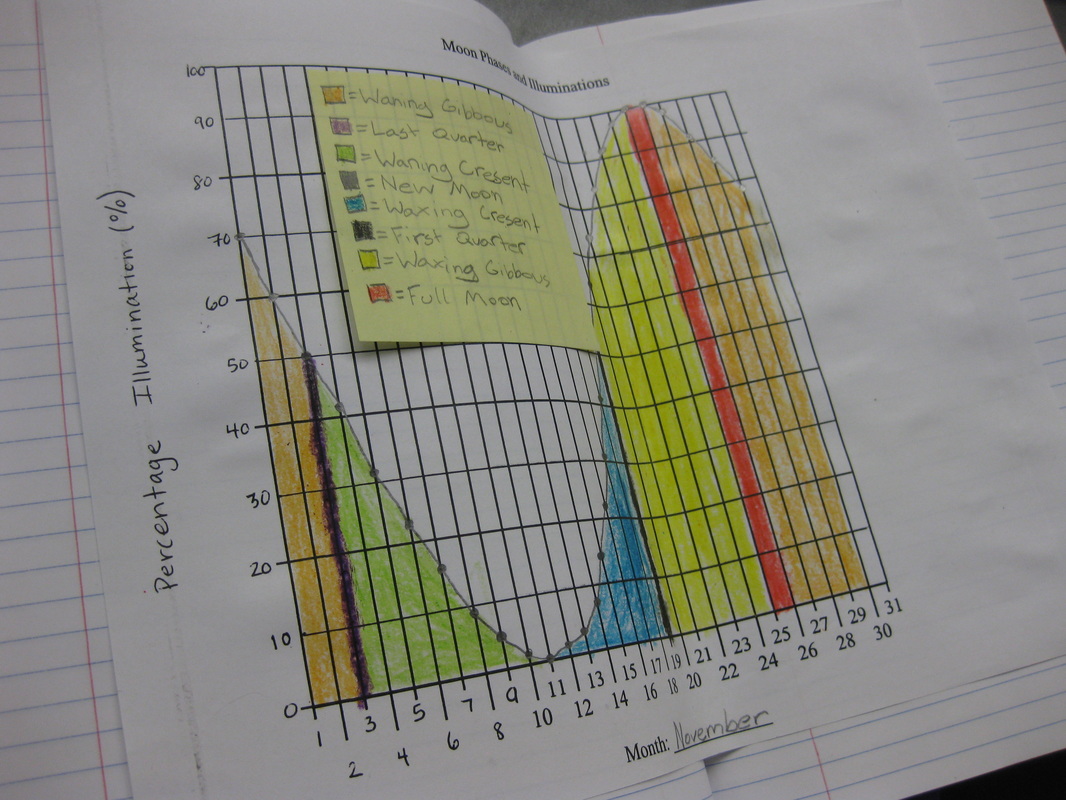
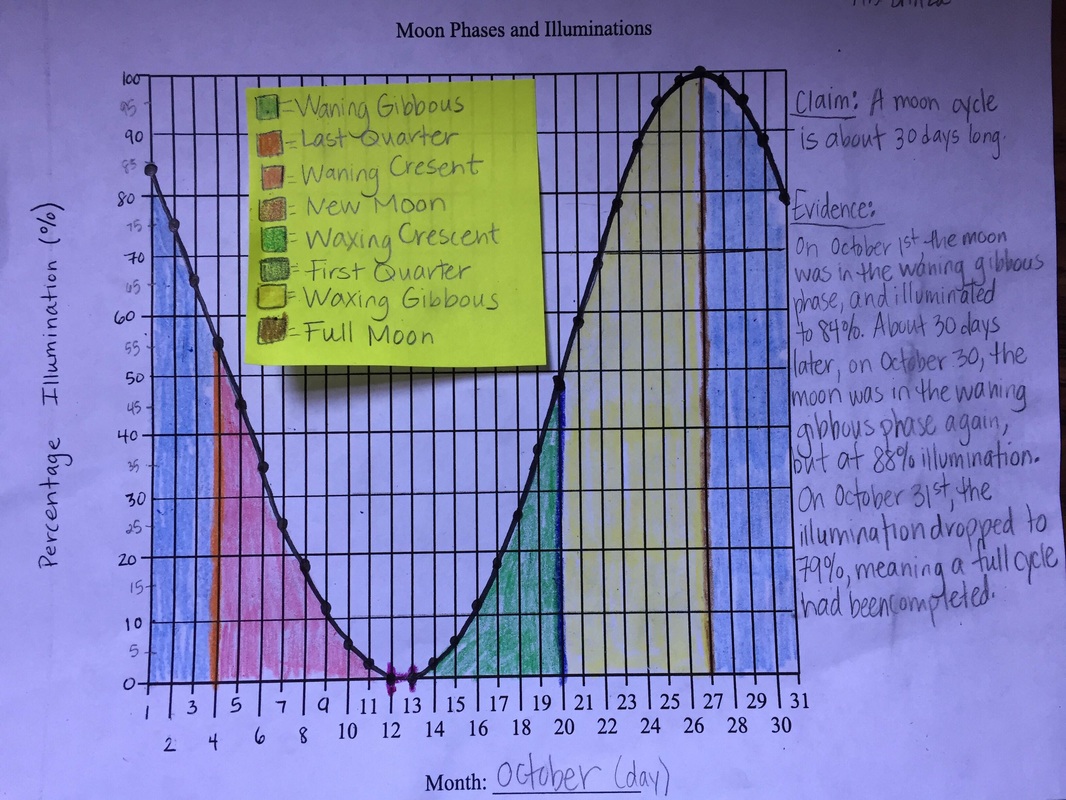
That good 'ol moon just picks up right where it left off in December... ;-) 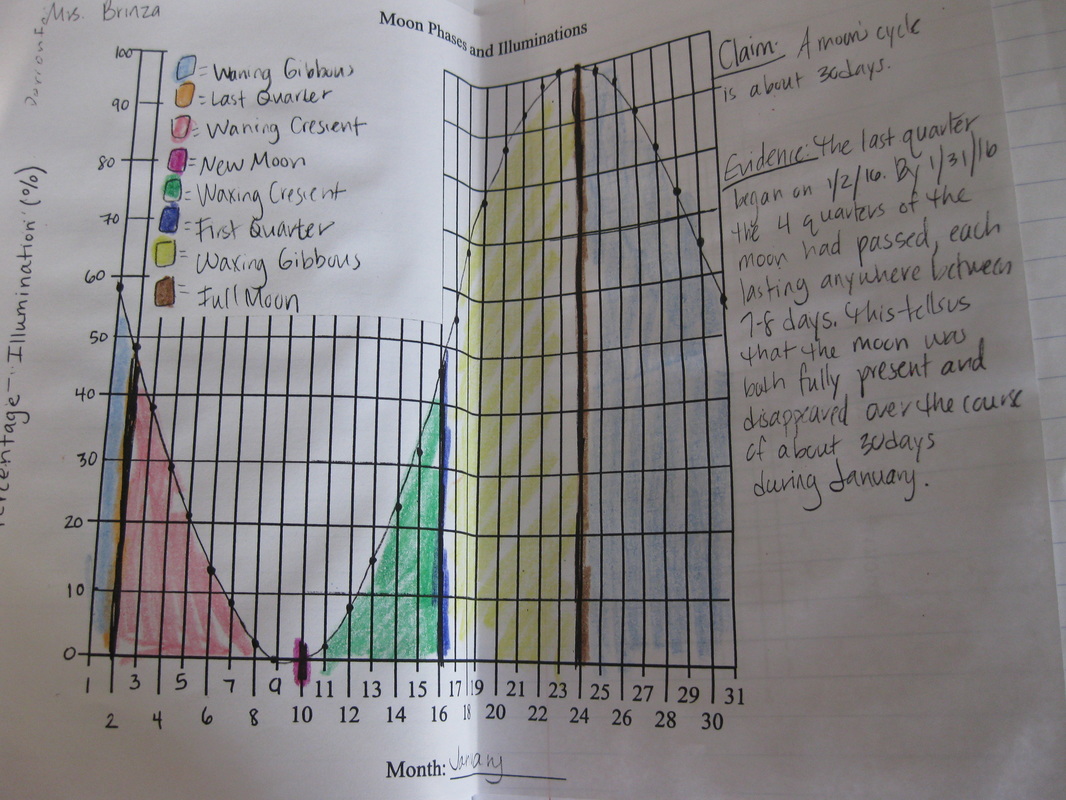 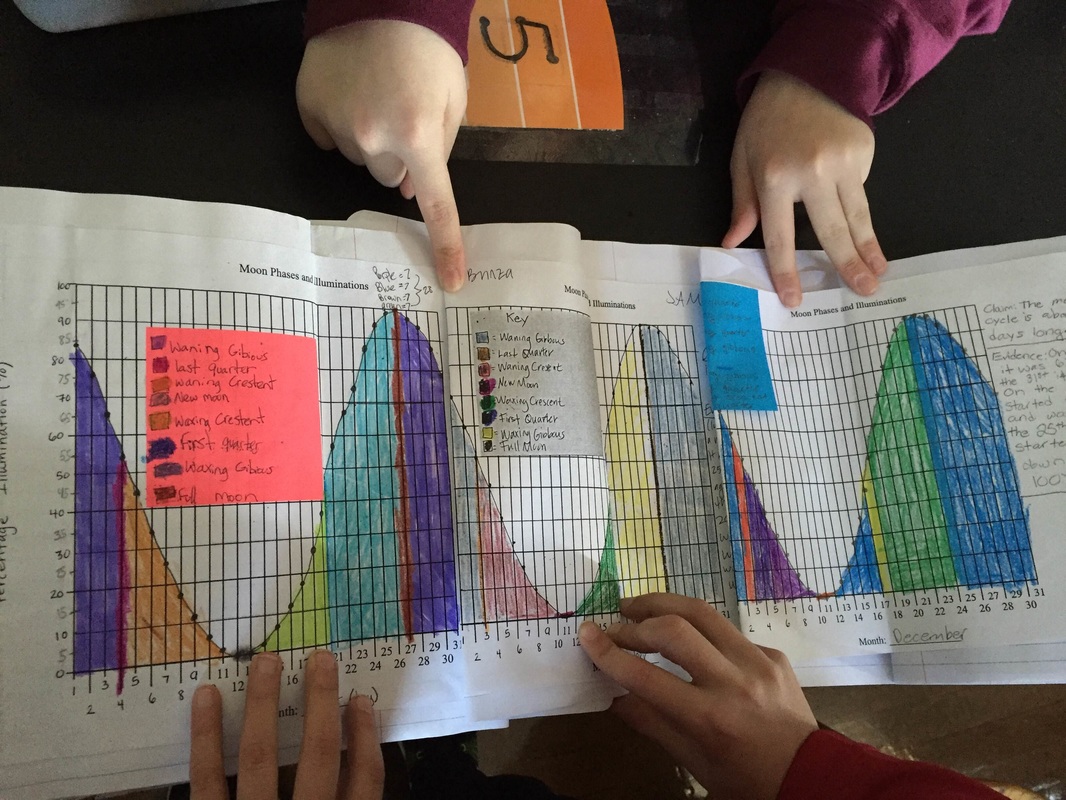 So after collecting data for three months, students connected their three moon graphs to see some patterns emerge. What did students notice?
1. Where one month "leaves off" another month "picks up." This means that the moon cycle is a continuous flow. 2. The full moon reappears every 29-30 days, and we saw this as a peak in our graphs. 3. Since the full moon reappears every 29-30 days, we can make predictions about when the next full moon will be each month! |
Mrs. BrinzaWhat does the sky look like tonight? The moon? The stars? Archives
February 2016
Categories |
 RSS Feed