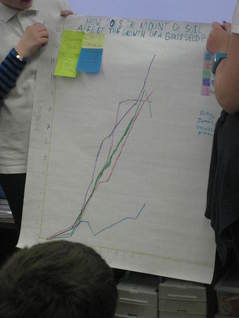
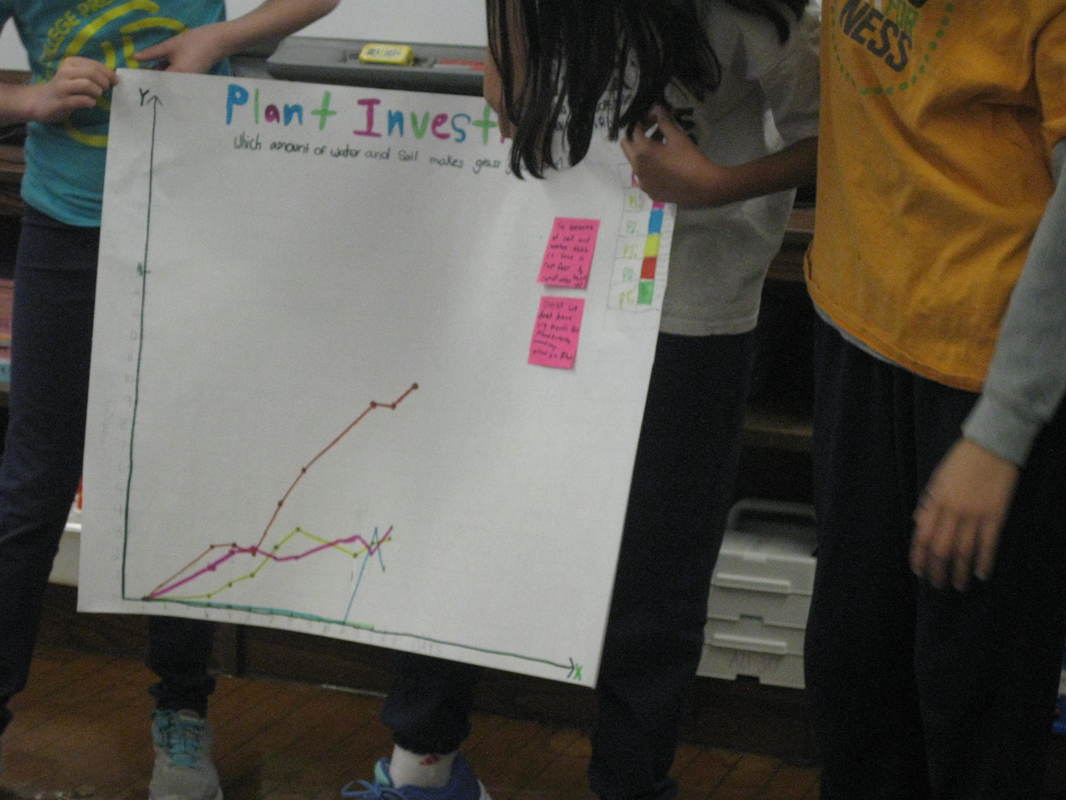
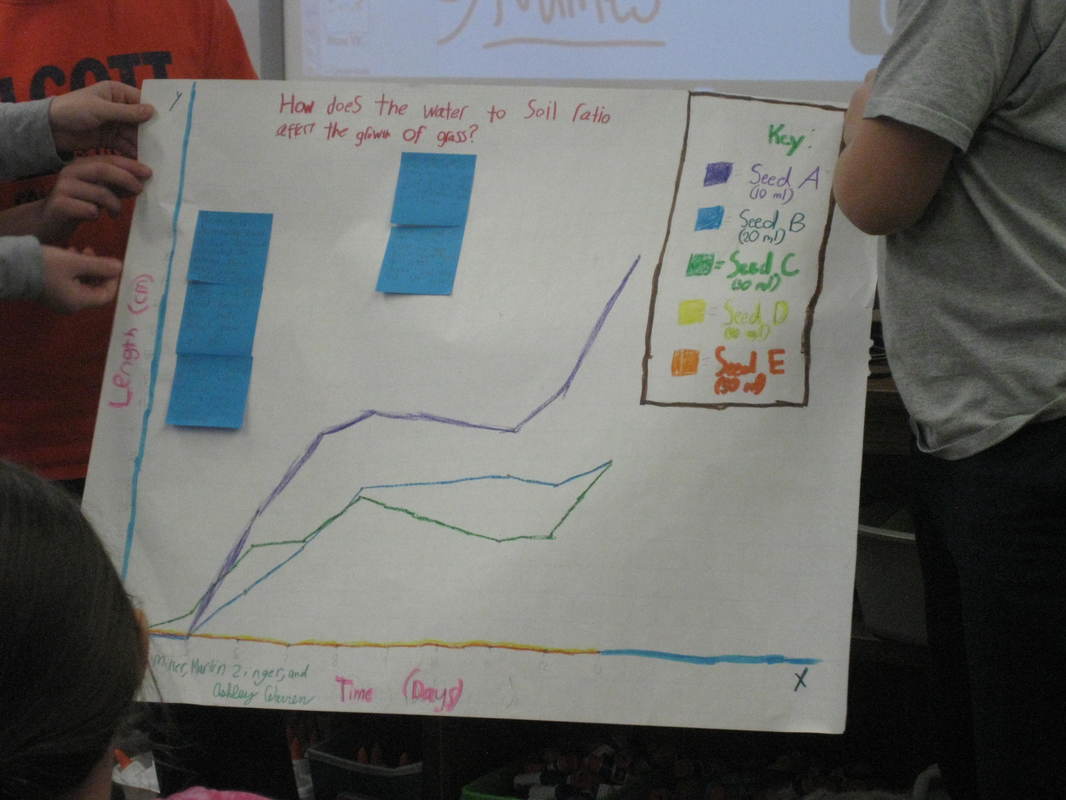
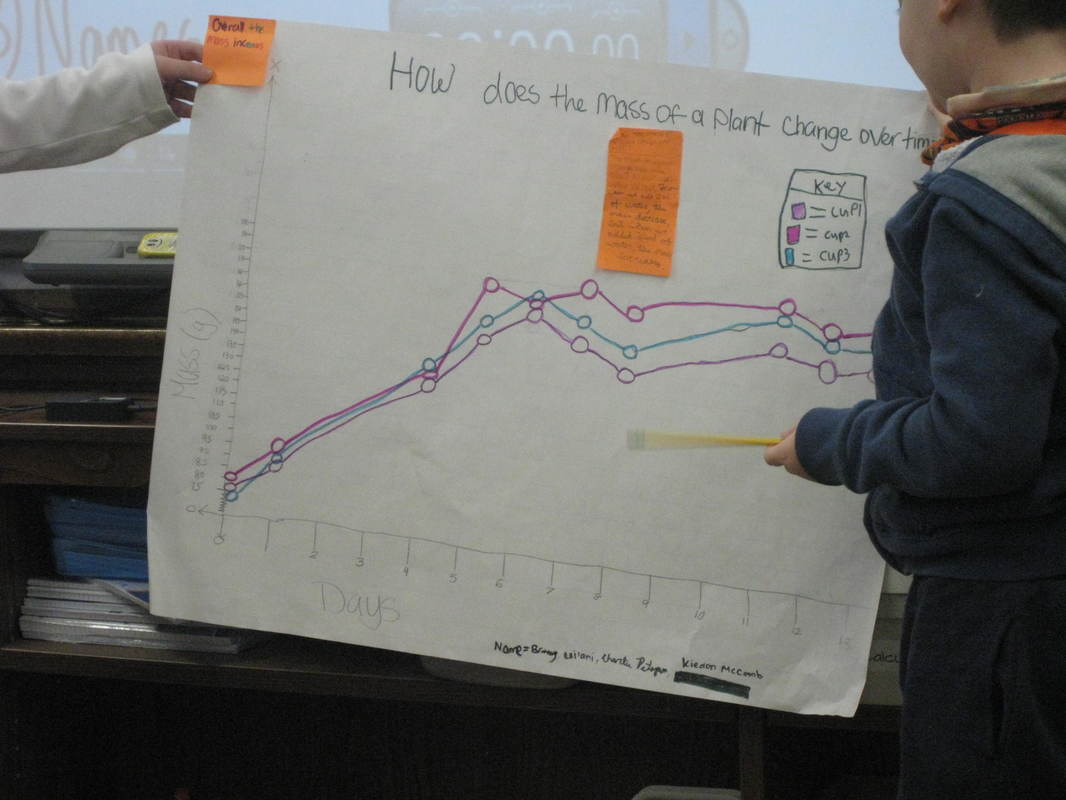
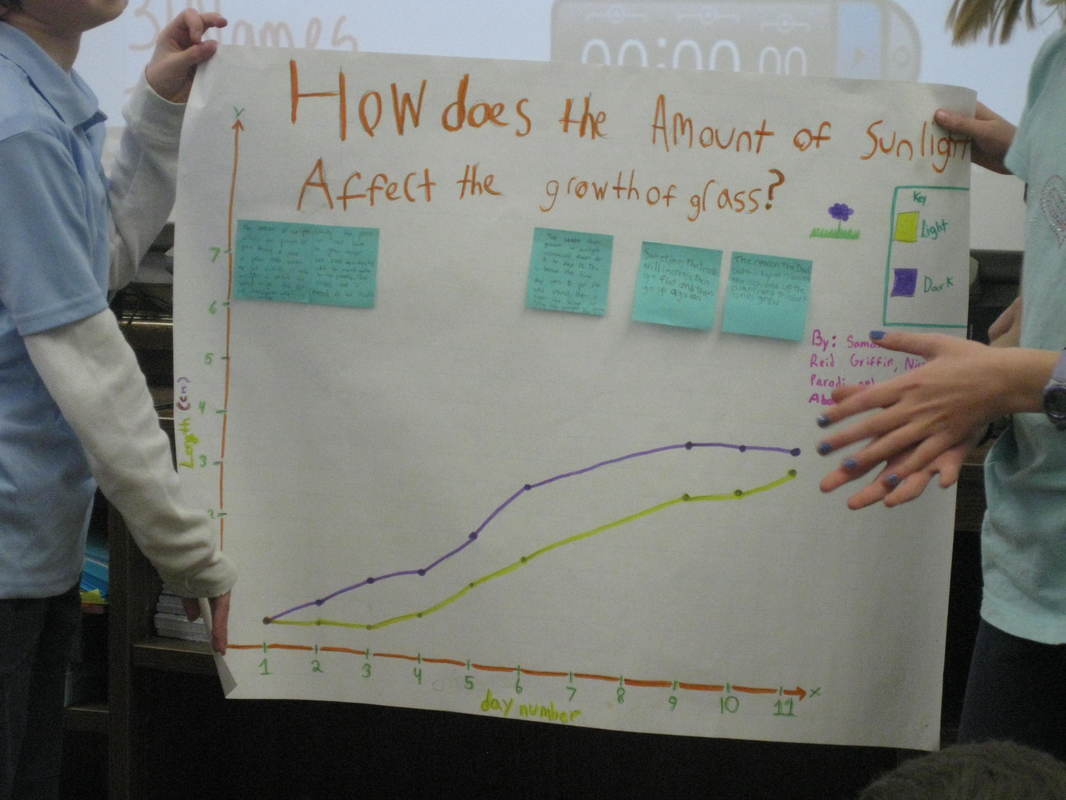
 | As fifth graders wrapped up their plant investigations, they had a chance to create a group graph of the data they collected. Each graph was a mathematical model to answer the question they originally set out to answer, and students had to identify any of the trends their model showed. Students began defending the reasons behind the trends...awesome work fifth graders! |
|
Comments are closed.
|
DataCan be... Archives
March 2017
Categories |
 RSS Feed