|
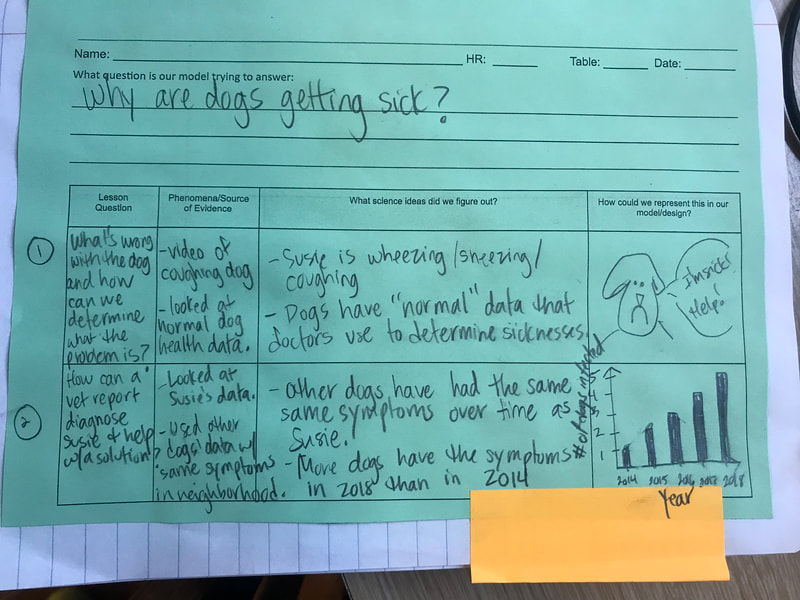
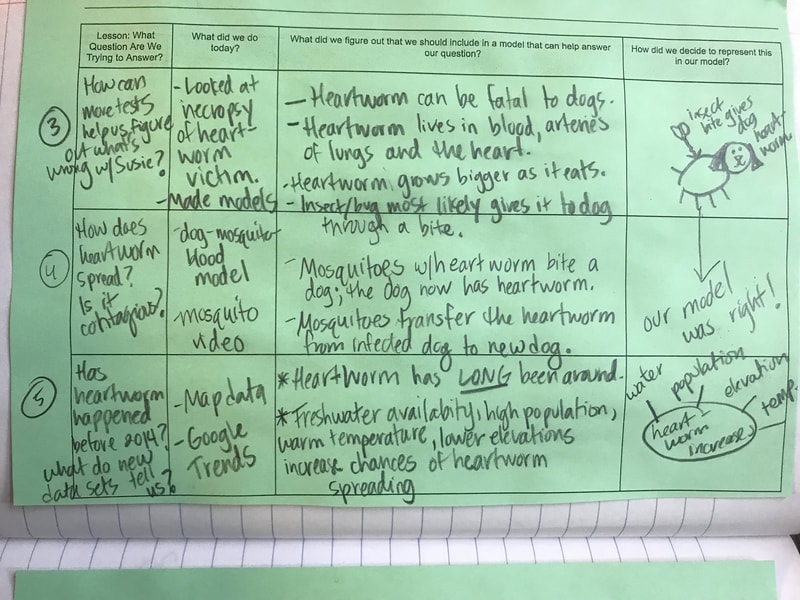
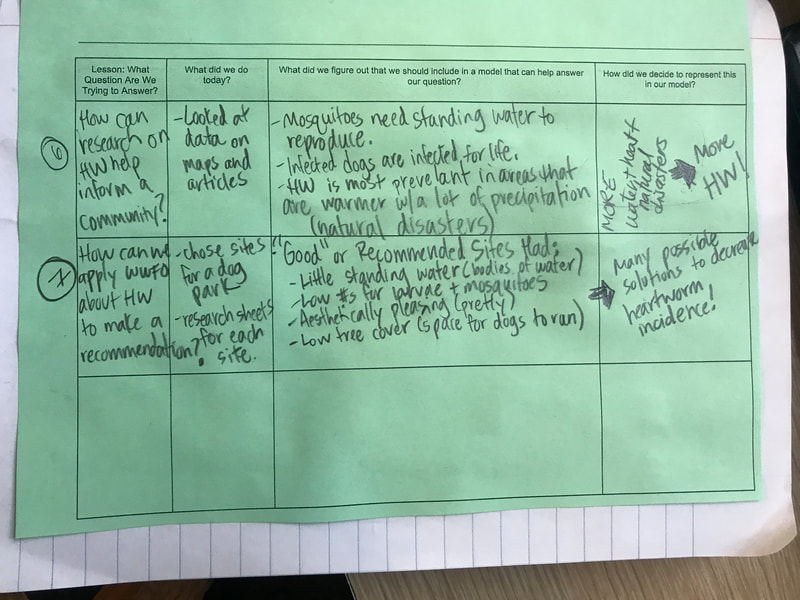
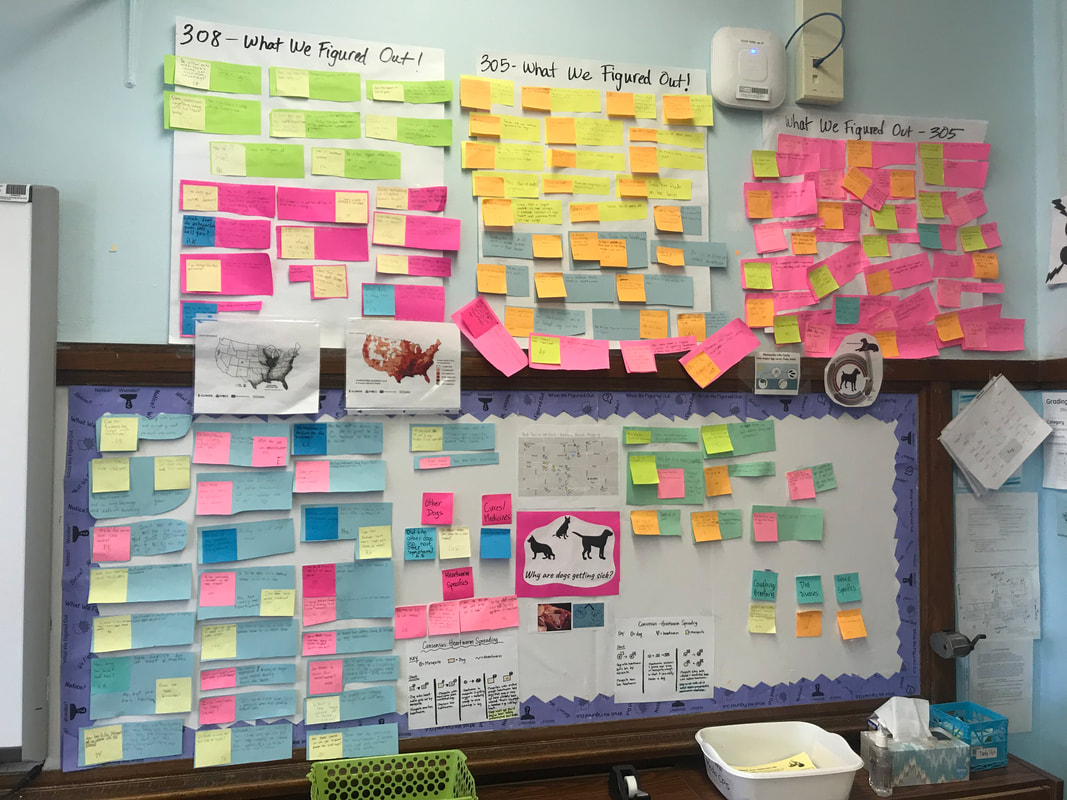
We've been keeping track of all the pieces of evidence we've gathered over time to answer our Driving Question: Why are dogs getting sick? We feel really successful in that we figured out not only how these dogs in Pooch Province are getting sick, but also how we can help inform a community about minimizing the spread of the disease that is making them sick in the first place. We're certainly heartworm experts now!
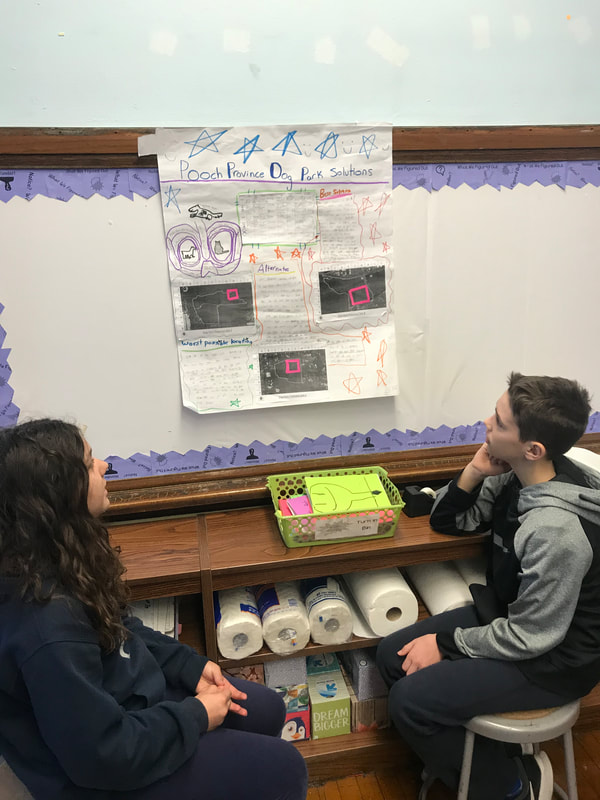
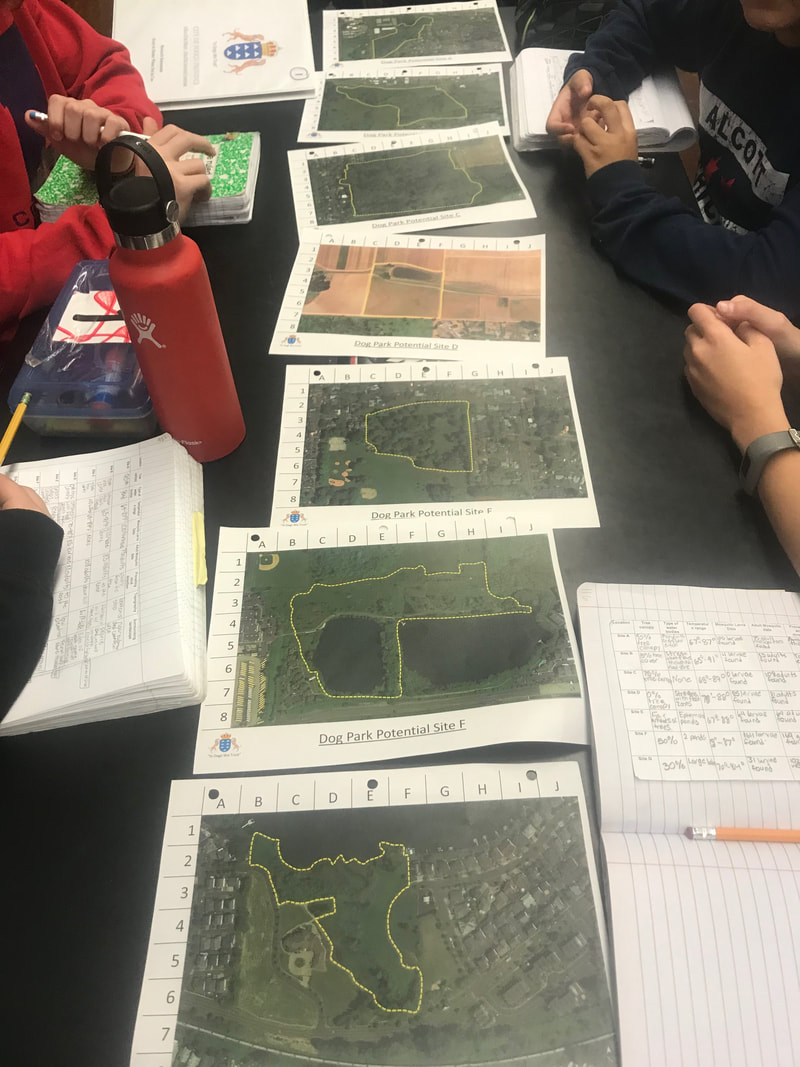
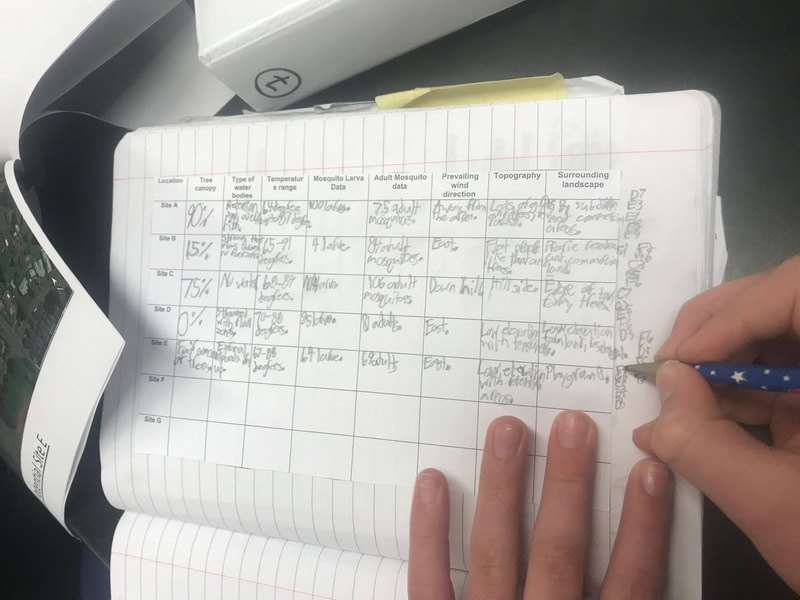
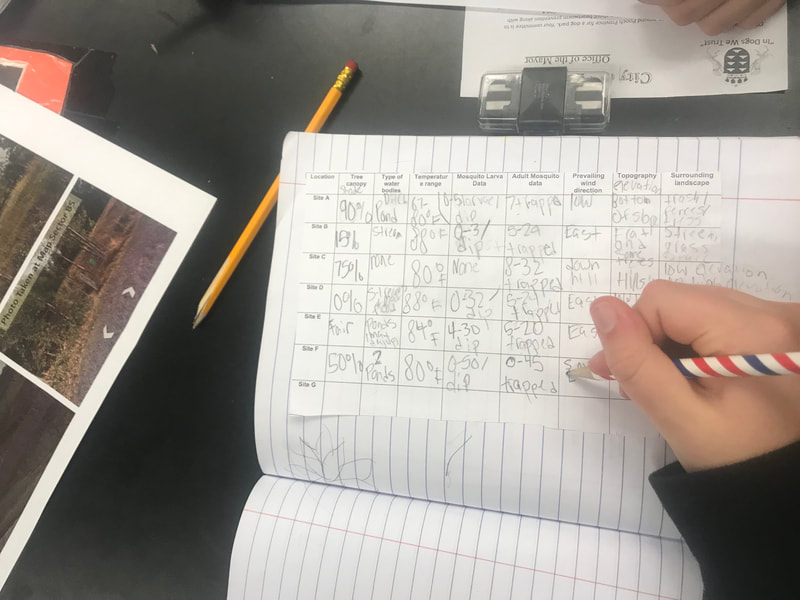
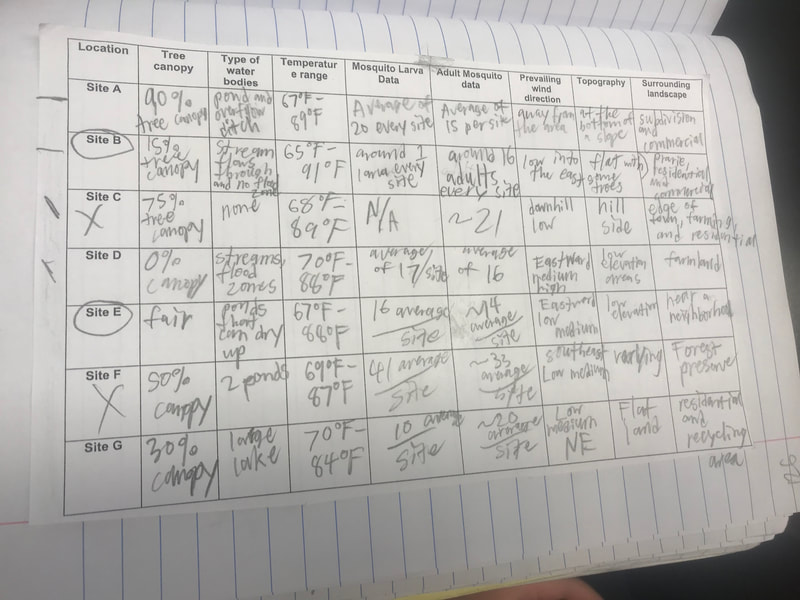
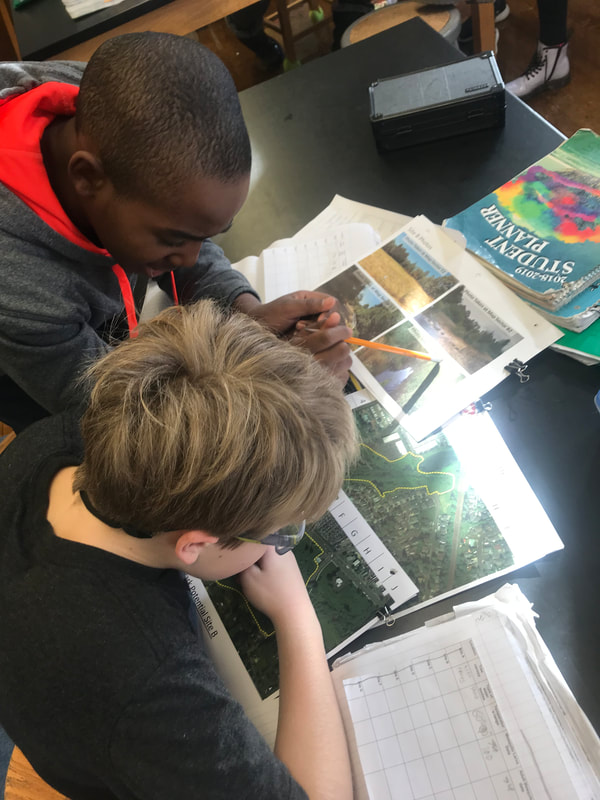
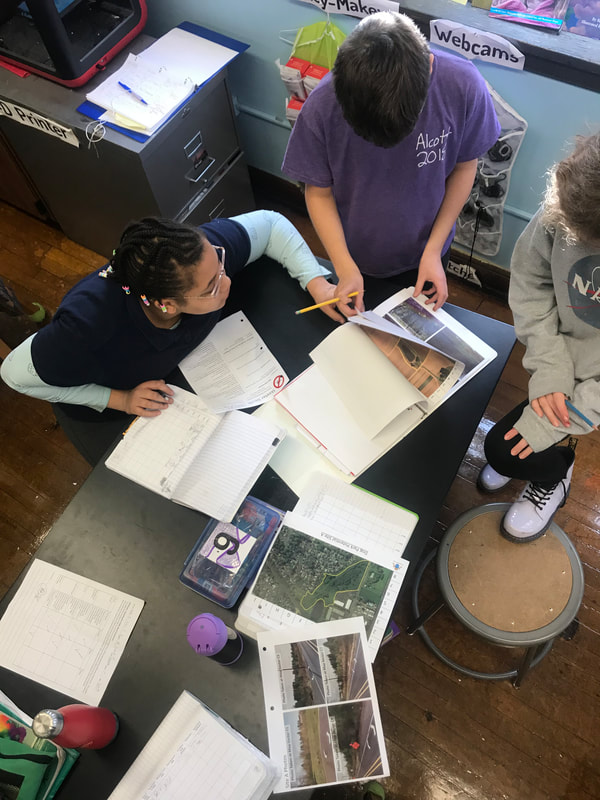
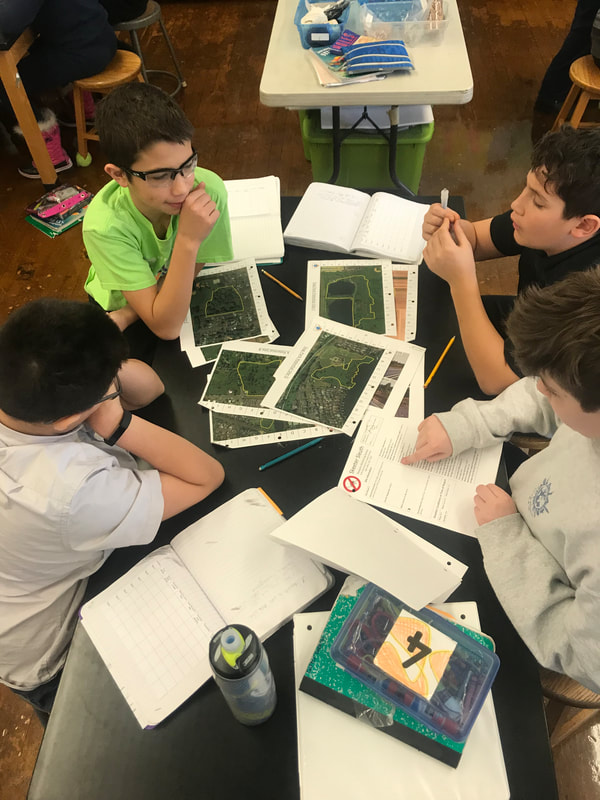
After intense research regarding the ins and outs of heartworm spreading, along with understanding what each of seven sites had available for a dog park in Pooch Province, student groups put all their ideas into action, recommending a site for a future dog park, along with an alternate and obvious NO for a choice!
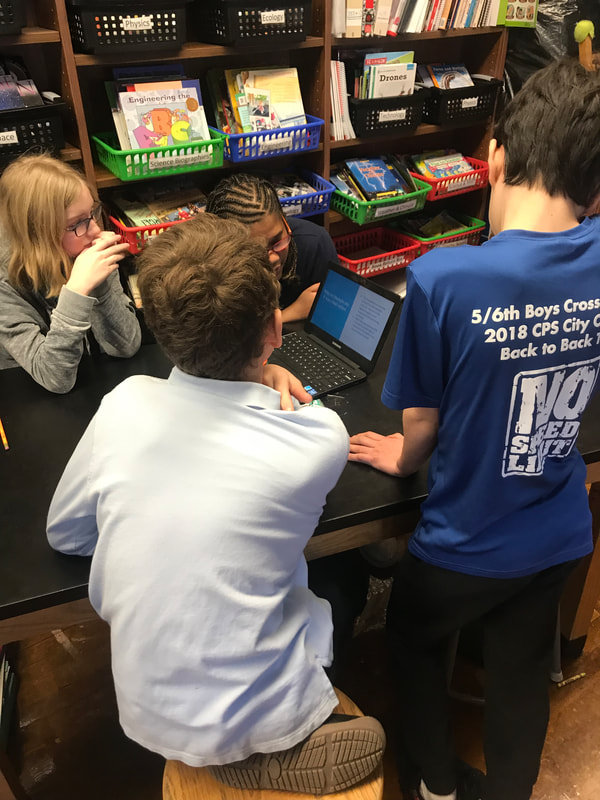
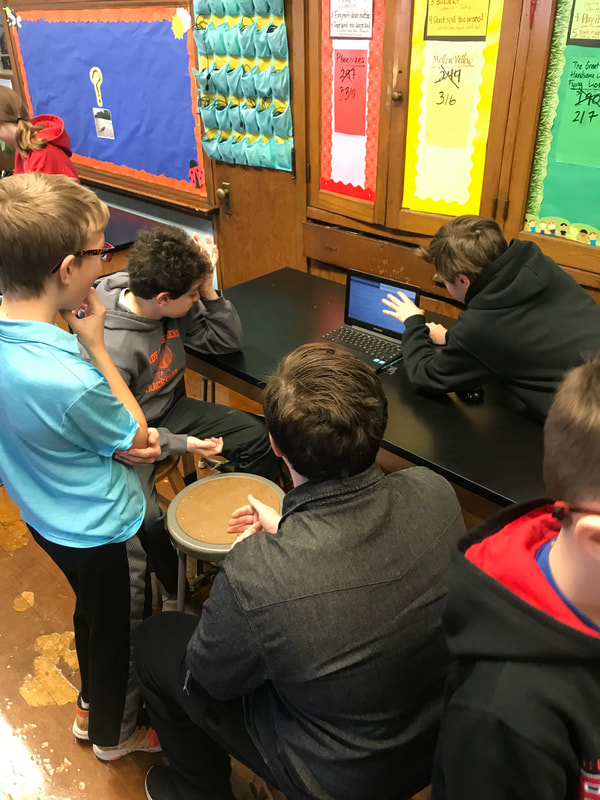
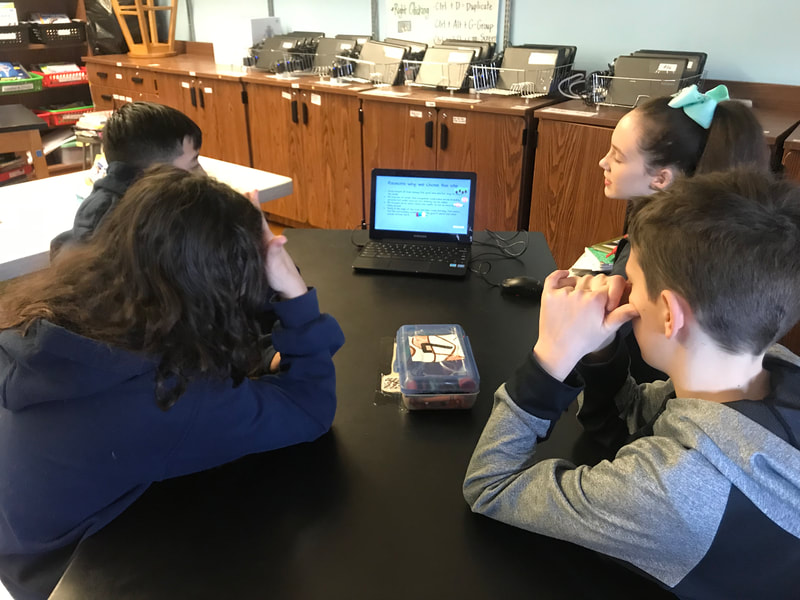
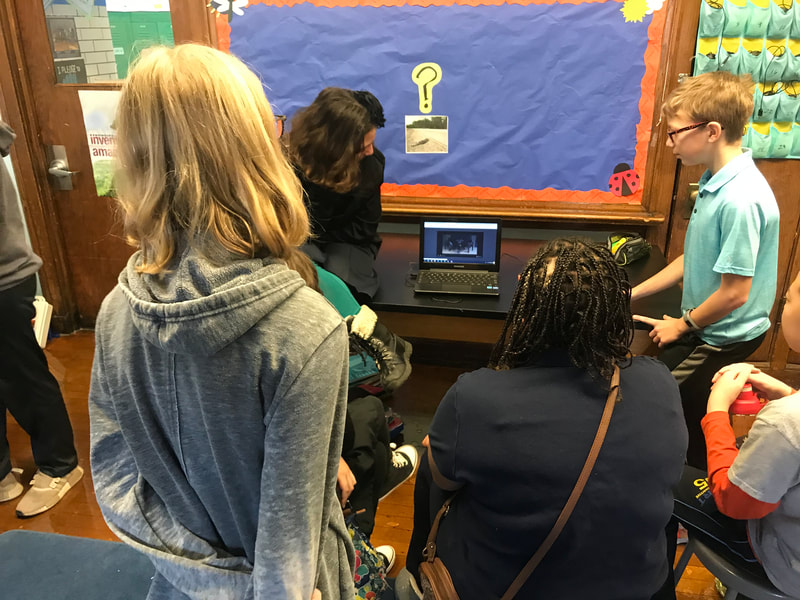
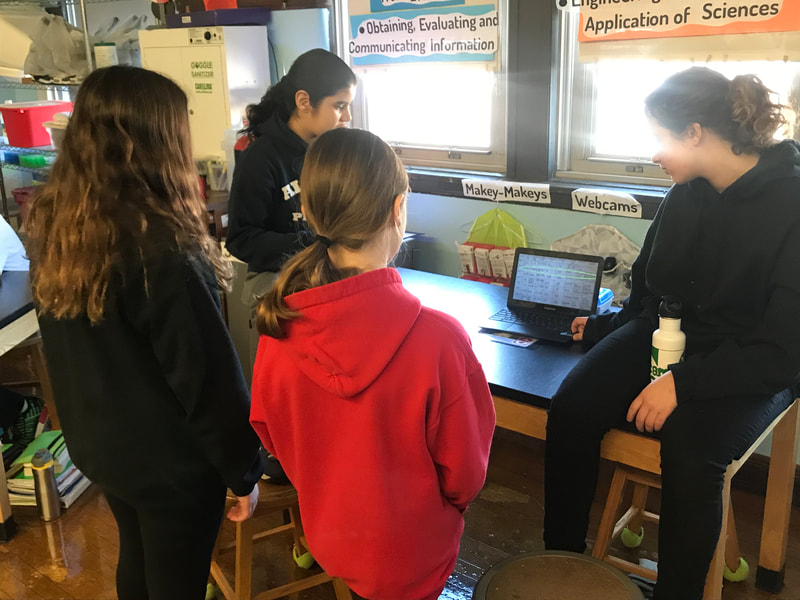
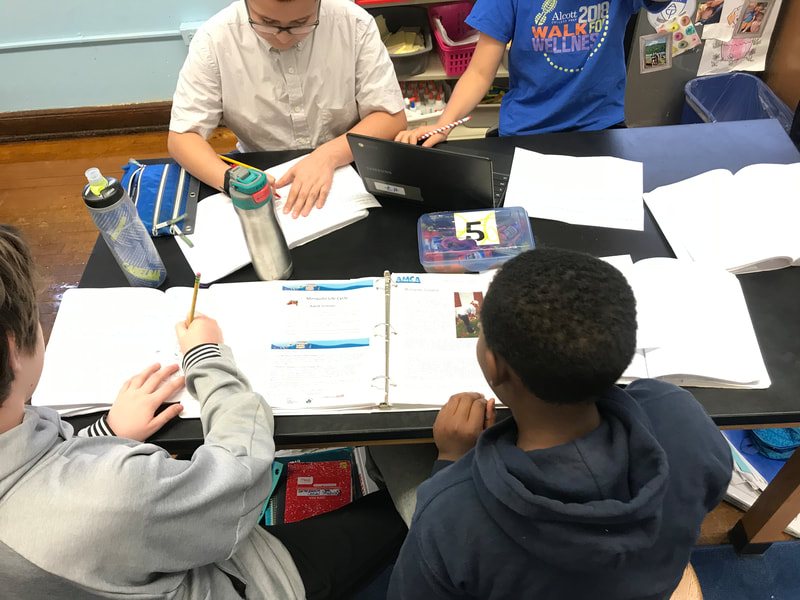
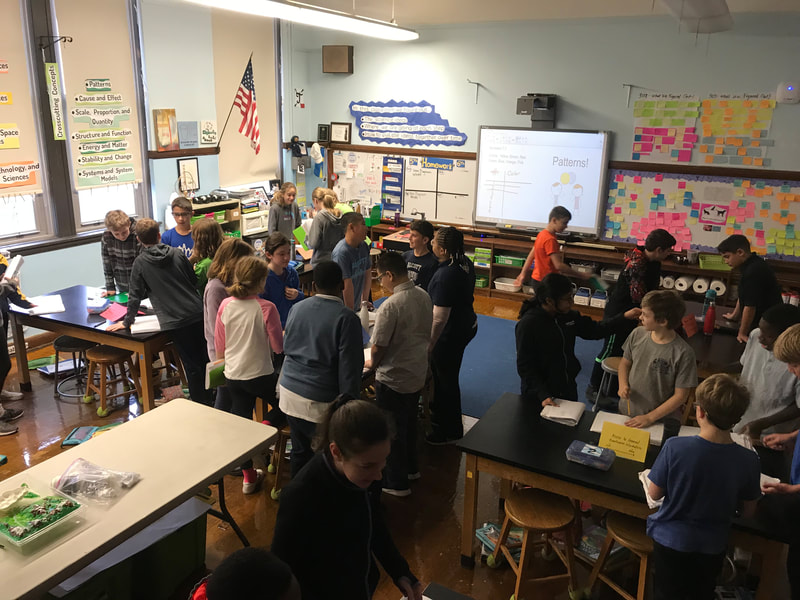
It was really neat to see students combine ideas from all their subject areas into a science-based project, including skills they've been picking up from their focus on various digital literacy projects we work on during homeroom. We had students share out their findings in small groups as the class completed a gallery walk! Check out all their work!
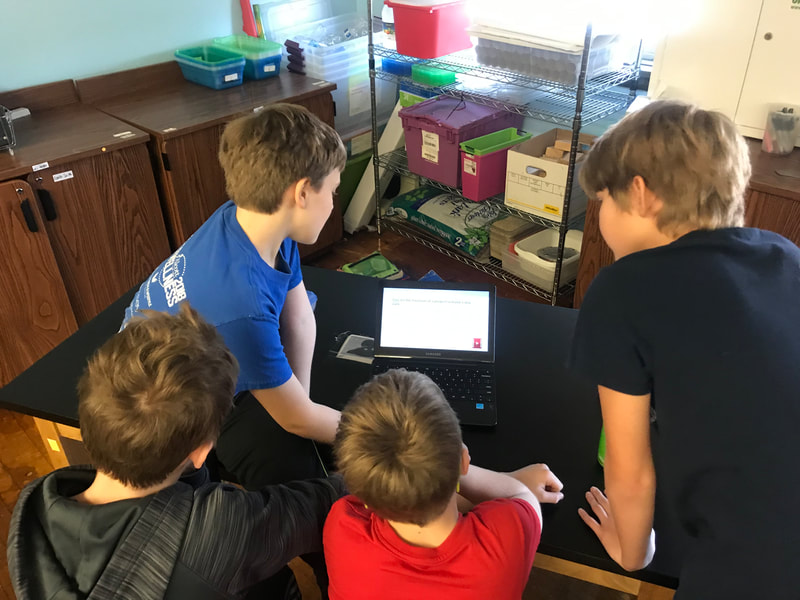
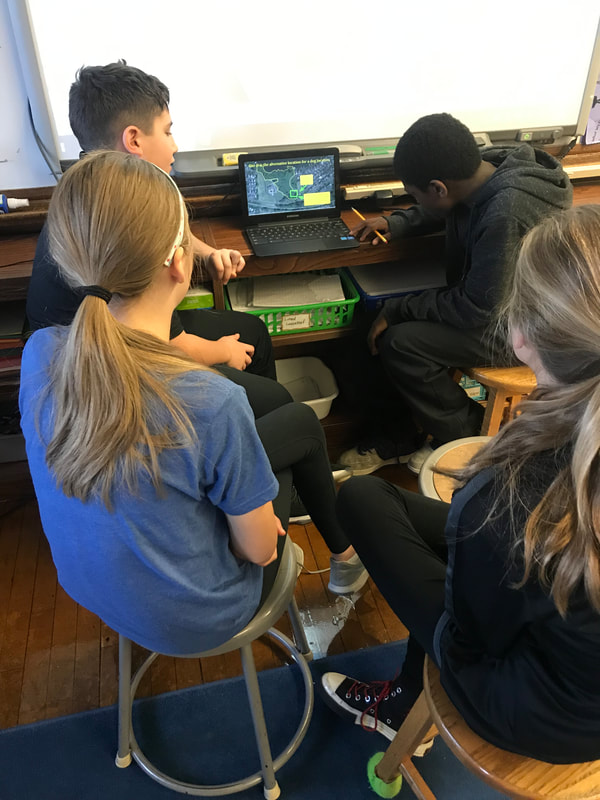
We hit the ground running organizing all the data from our potential dog park sites! We are looking at maps, photos, and mosquito monitoring data, all while hoping to choose an ideal site, a back-up site, and a site that we'd NEVER recommend. Be on the lookout for presentations near the end of the week!
After all our research and consensus building, students wanted to revisit the DQB to see what questions we could answer. Boy could we answer a lot!
This prompted us into starting our Dog Park Project per the request of Pooch Province. Since our students are experts on heartworm, they're going to put all their new found knowledge about the spread and prevention of heartworm into action. Using maps, photos, and mosquito mapping evidence, students will recommend various sites for a dog park in a community seemingly hit hard by the effects of heartworm. Be on the lookout for their proposals to Pooch Province's City Council!
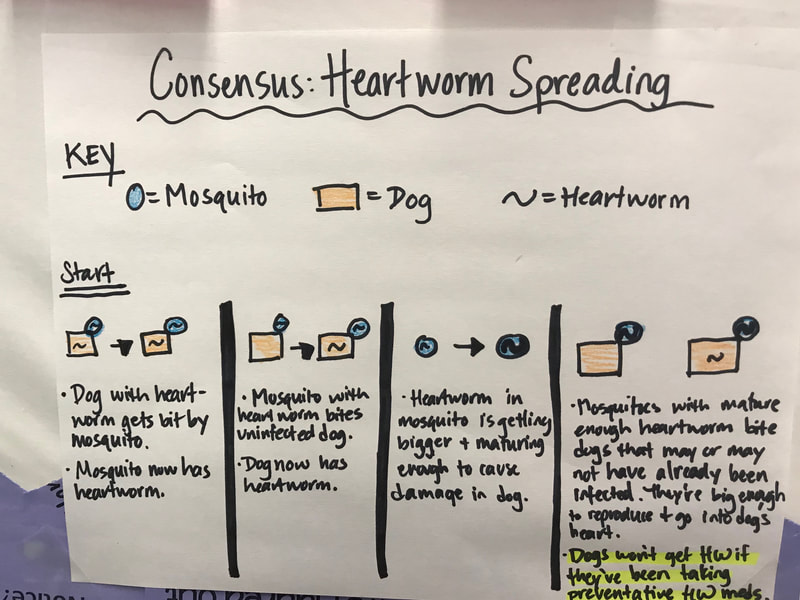
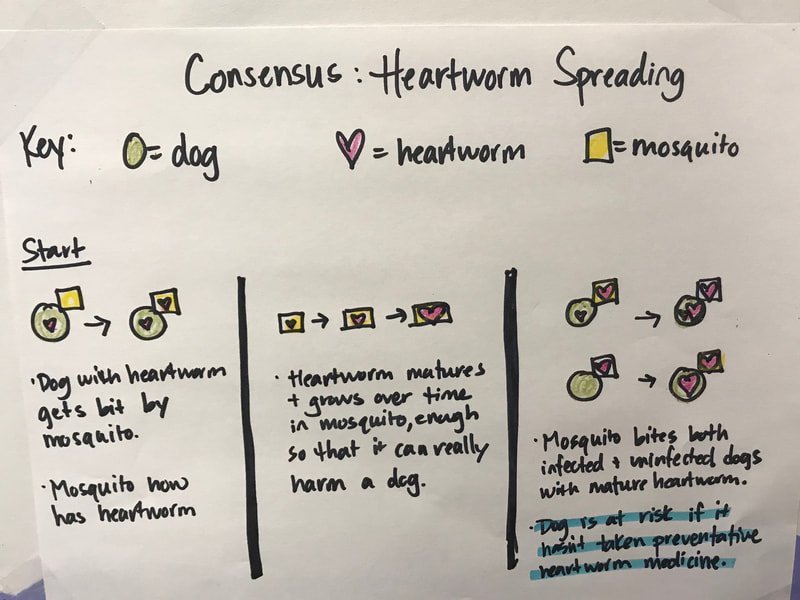
While we've certainly been learning a lot from our research, we've also learned a lot more about how heartworm spreads. We built consensus models today, remembering to keep them simple. As we work through understanding the data presented on various maps involving temperature and precipitation changes over time, we are keeping the ideas we built about how heartworm spreads alive in our minds.
Students will be selecting a dog park location in Pooch Province, so understanding more about heatworm, mosquitoes, and the factors that affect its spread will all come in to play. Keep up the great work, 6th graders! With all the questions we still have about heartworm, mosquitoes, data, and more, we turned to research to help us. We know that scientists use the work of others to make progress, to better understand a phenomenon, as well as to develop solutions to problems that surface.
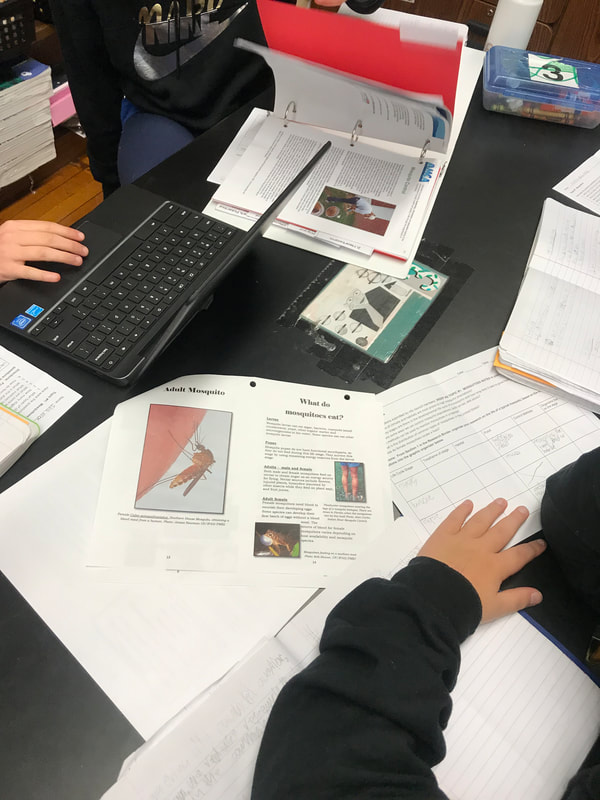
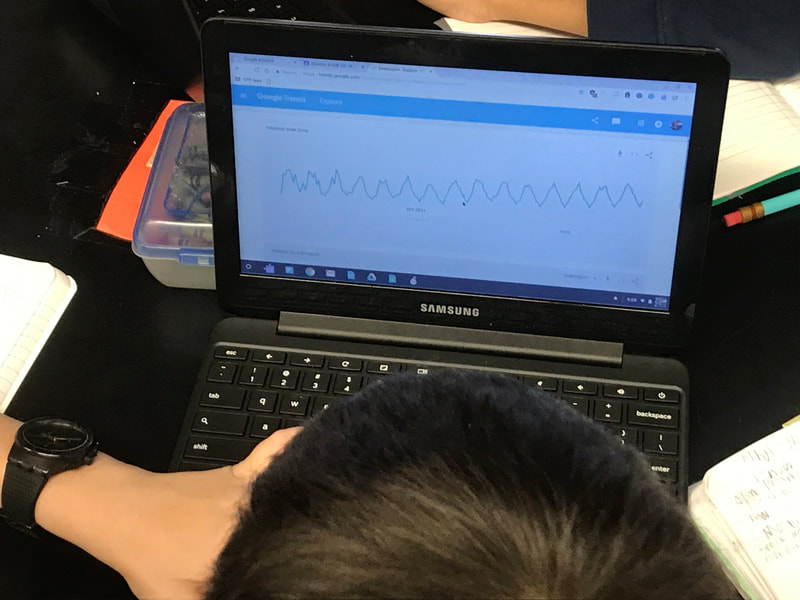
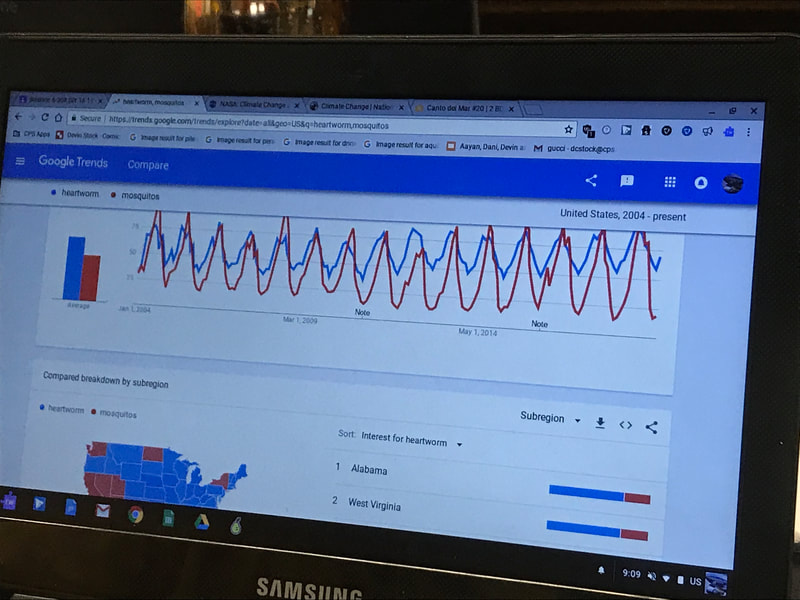
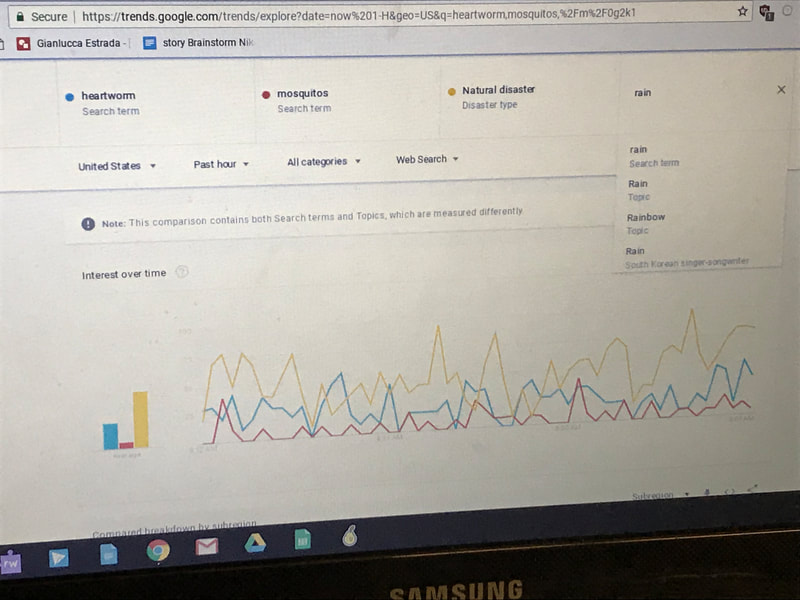
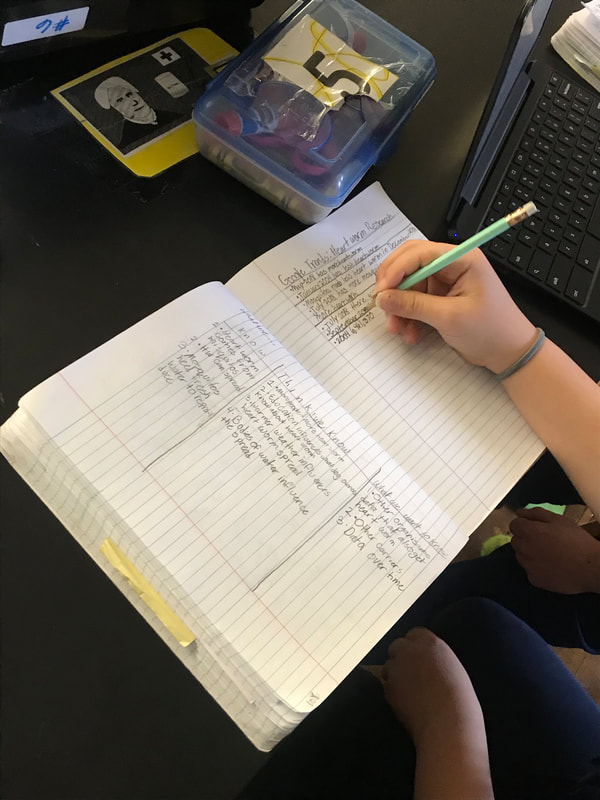
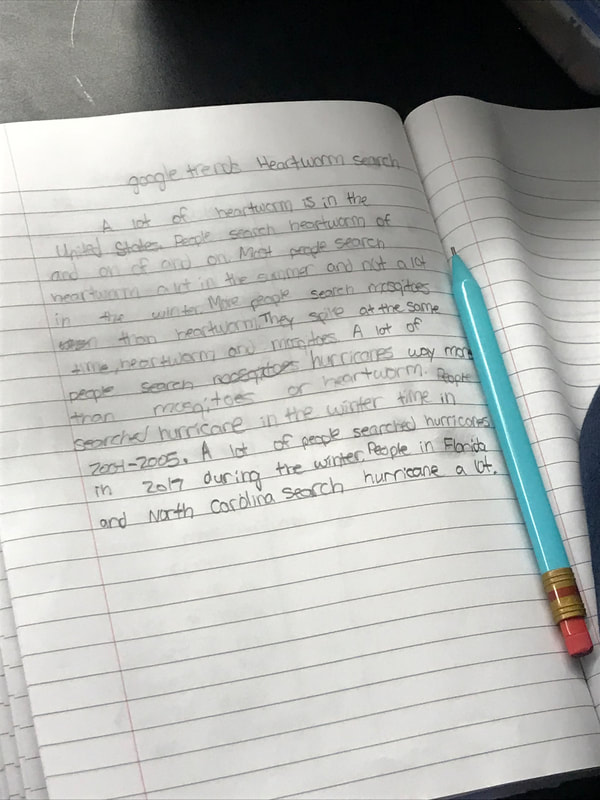
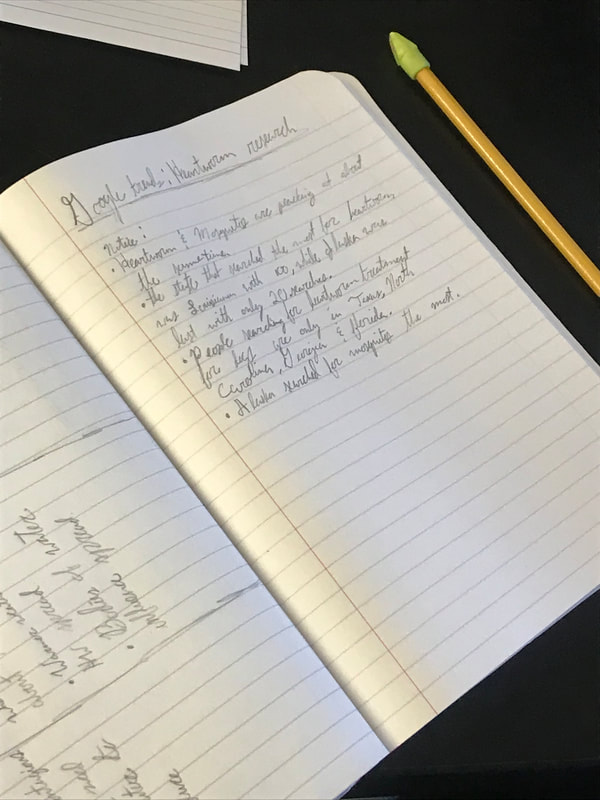
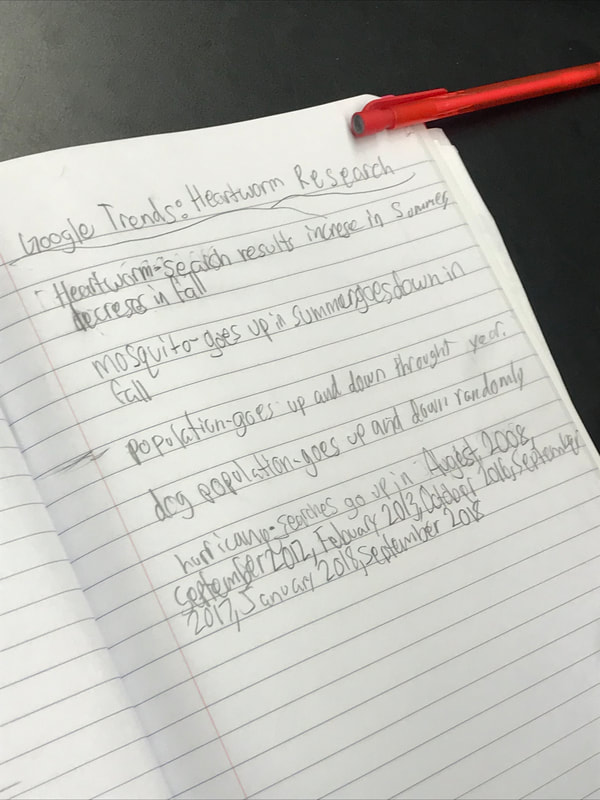
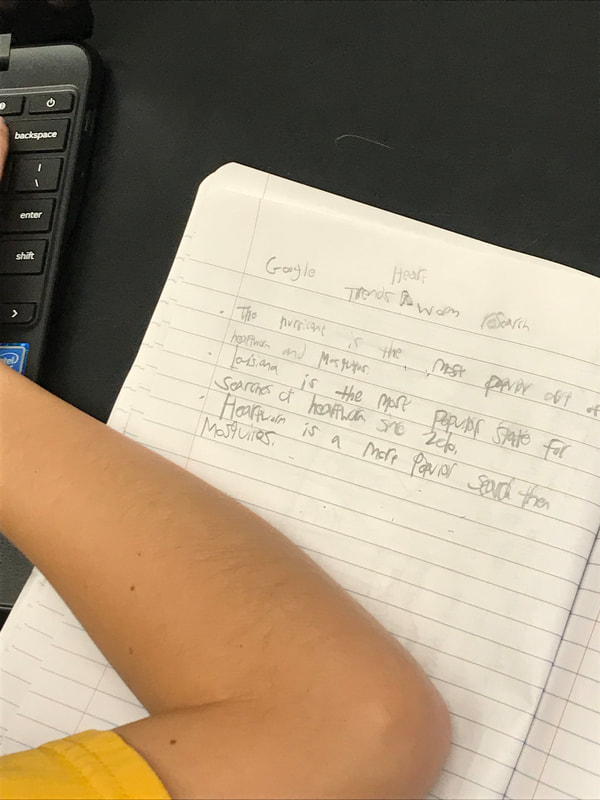
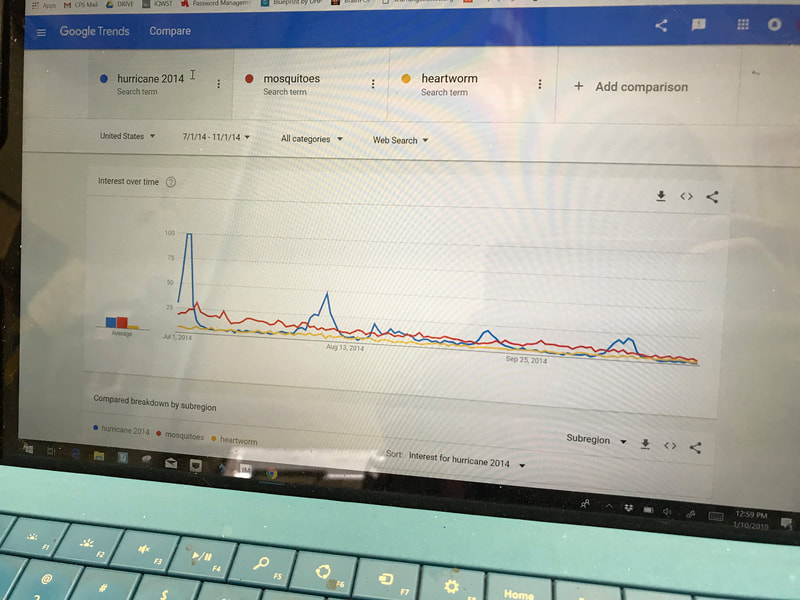
We're using research to better understand four subtopics that have come up time and time again. 1. Mosquitoes 2. Heartworm 3. Mapping (Data over time) 4. Natural Disasters Students are working diligently to gather and make sense of the information they're collecting. Hats off to 6th graders for plowing through this slowly but surely! So we agreed that we needed to find more data over time, and that maybe changes in the factors we have found to be influencing the spread of heartworm could give us more insight. We turned to Google Trends as a way to see what is being searched on the Internet and how this could impact our thinking behind the spread of heartworm.
We agreed upon our search terms (i.e. heartworm, mosquitoes, hurricanes, temperature increase, etc.) and came up with interesting ideas:
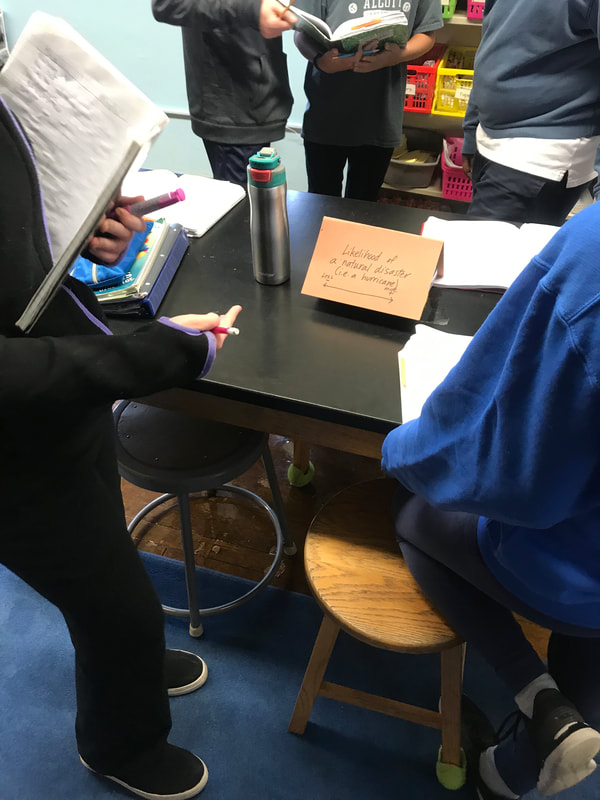
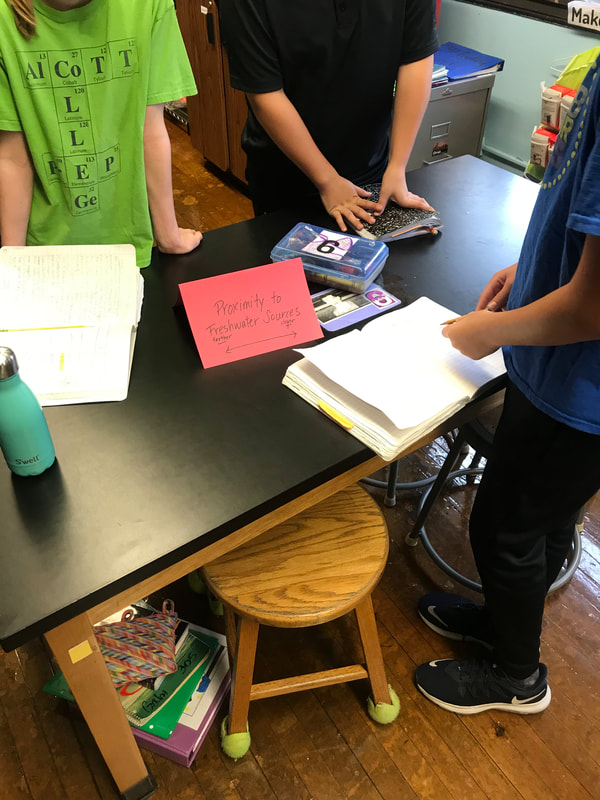
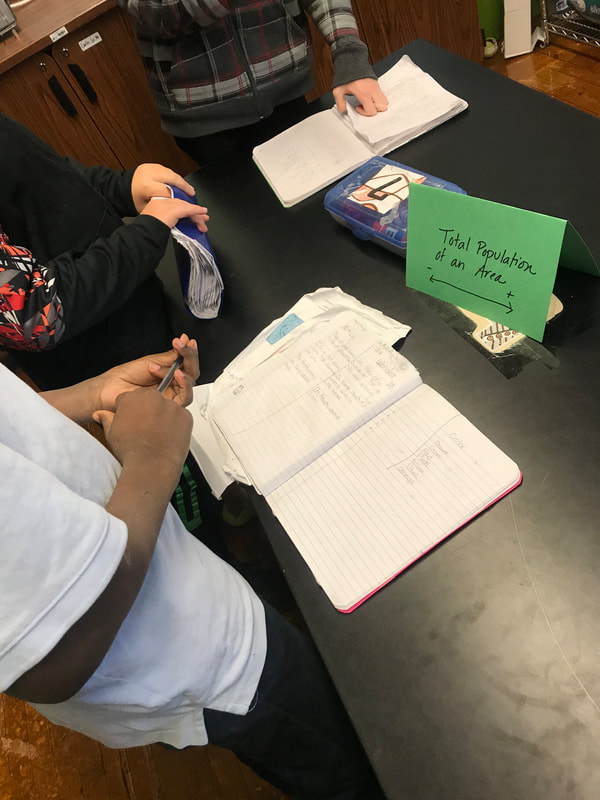
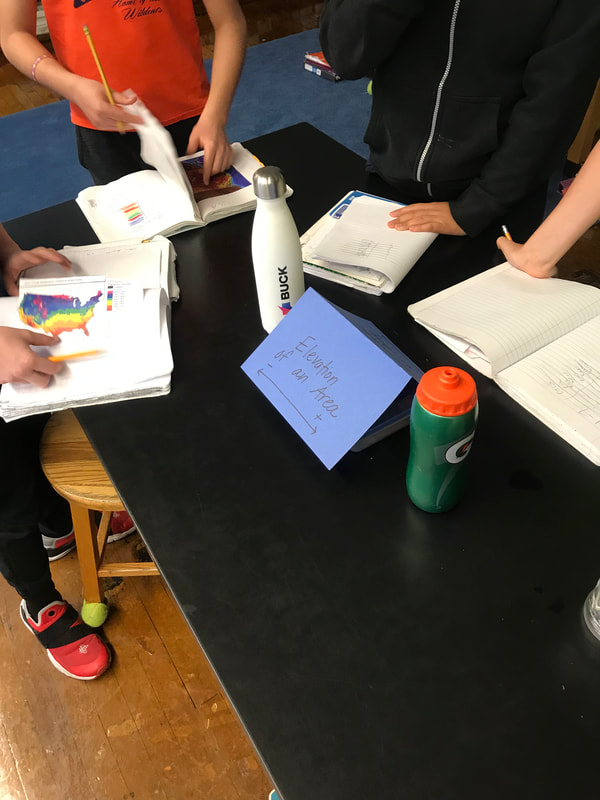
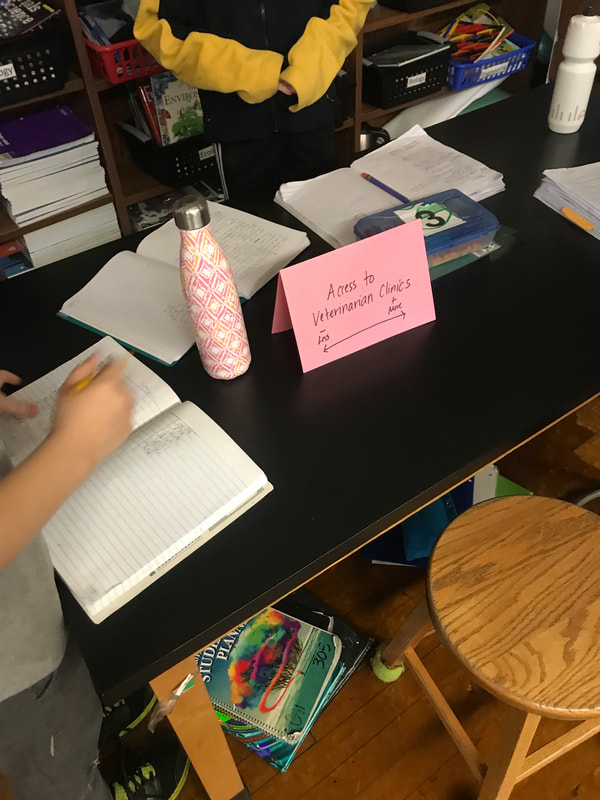
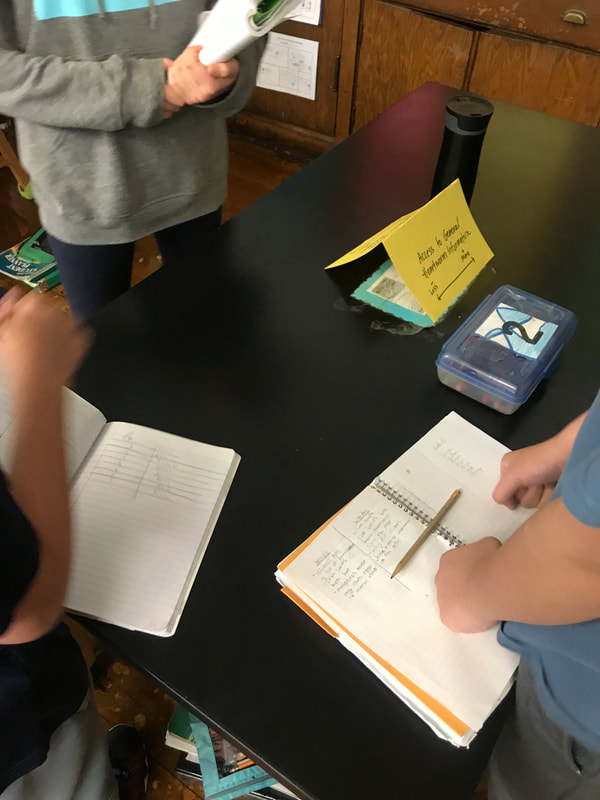
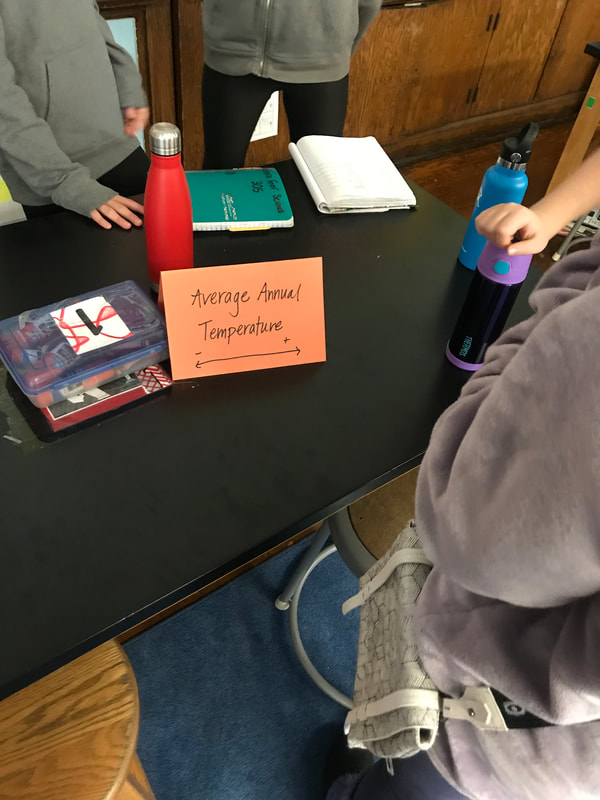
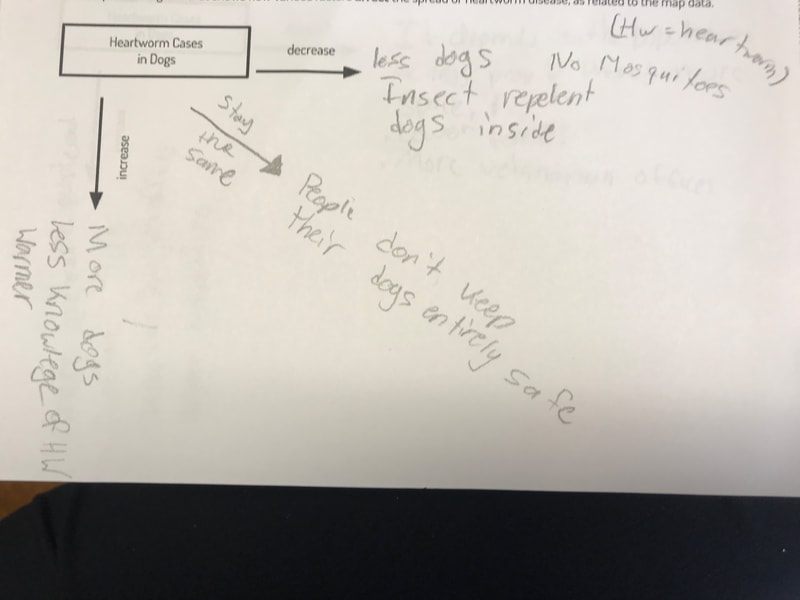
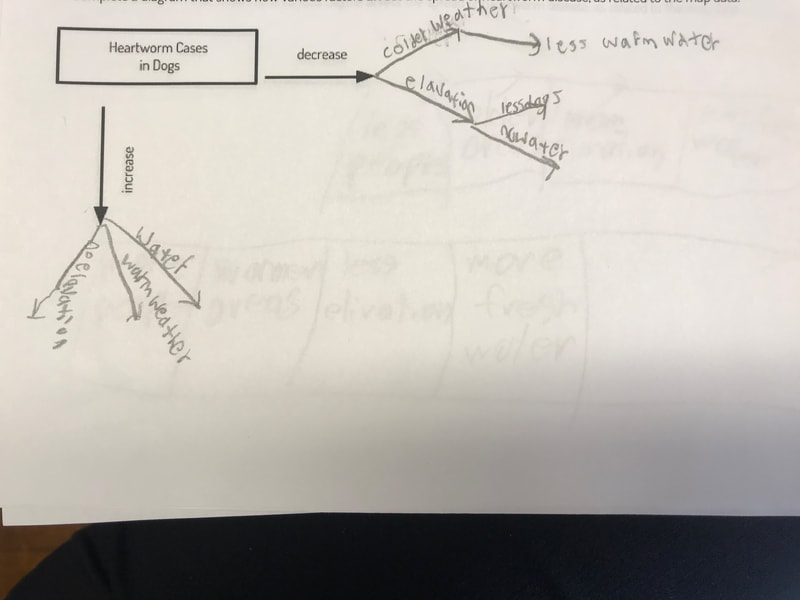
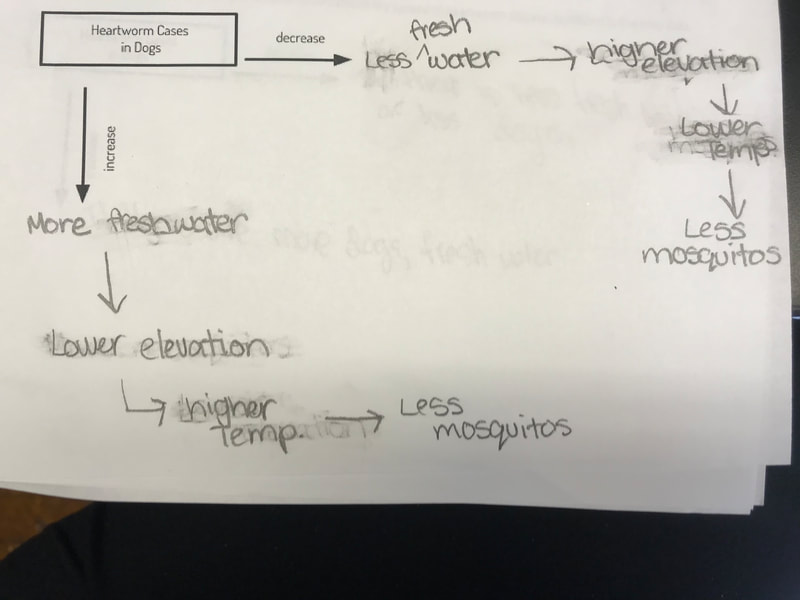
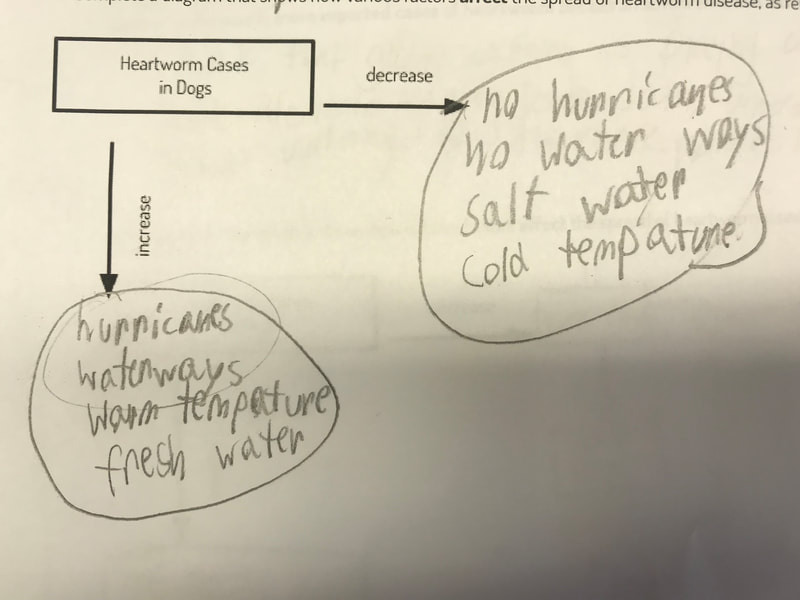
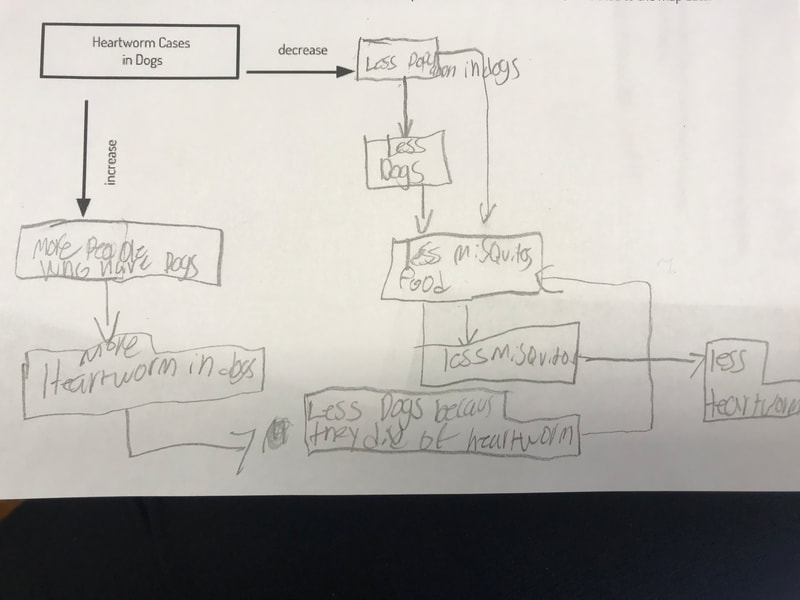
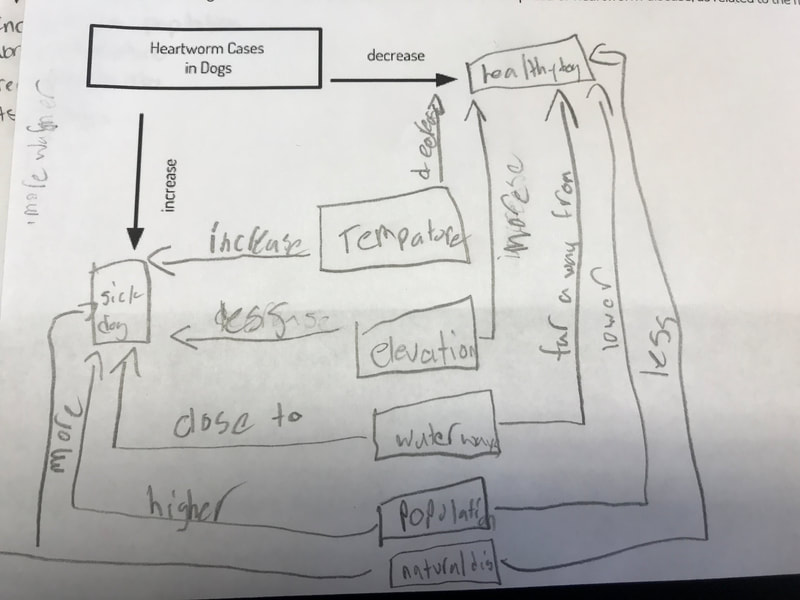
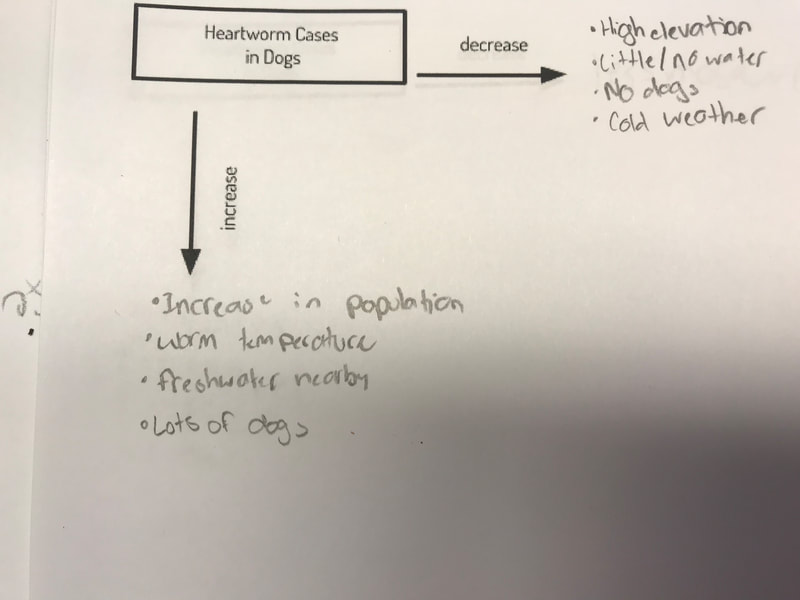
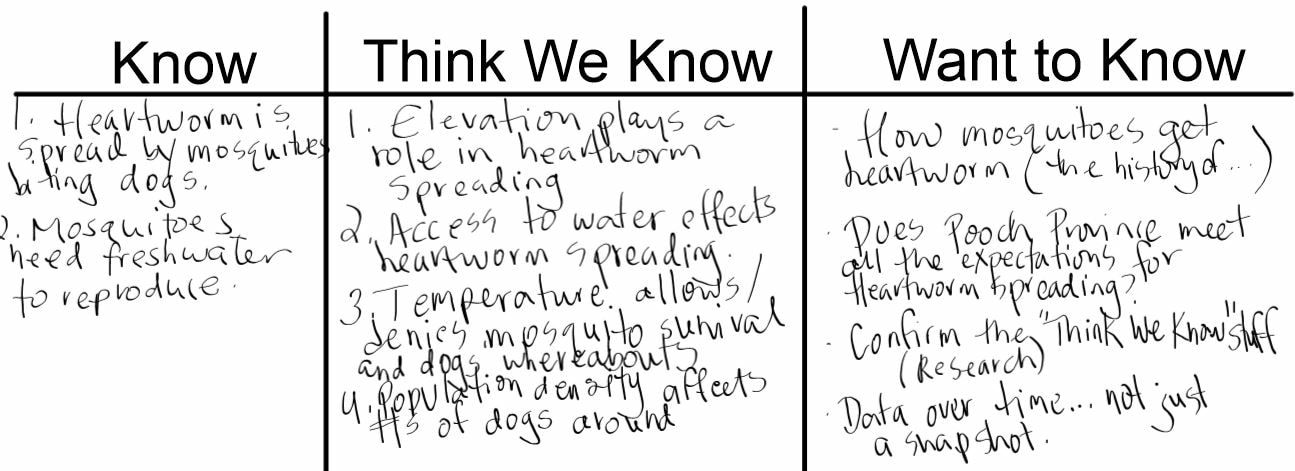
From all this research, we're thinking that looking at Google Trends is interesting, although it's not giving us the scholarly information we need to answer all our questions we've got about heartworm. Students are requesting more information (and better information, too). Research time it is! After a thoughtful scientist circle, we spent today summarizing our making sense of what all the maps told us. We did so by visiting various tables that had all the factors we identified that seemed to have an impact on the spreading of heartworm, making our thinking visible, as well as creating a safer space for conversation not in front of a big group. From here, students individually reported how every factor may have influenced either an increase or decrease in the number of heartworm cases. They were asked to do so by creating a diagram as we work to figure out our next steps! Our next steps for both sixth grade classes are using both what they know, and what they think they know. It looks like more research (with access to information over time) is our best bet!
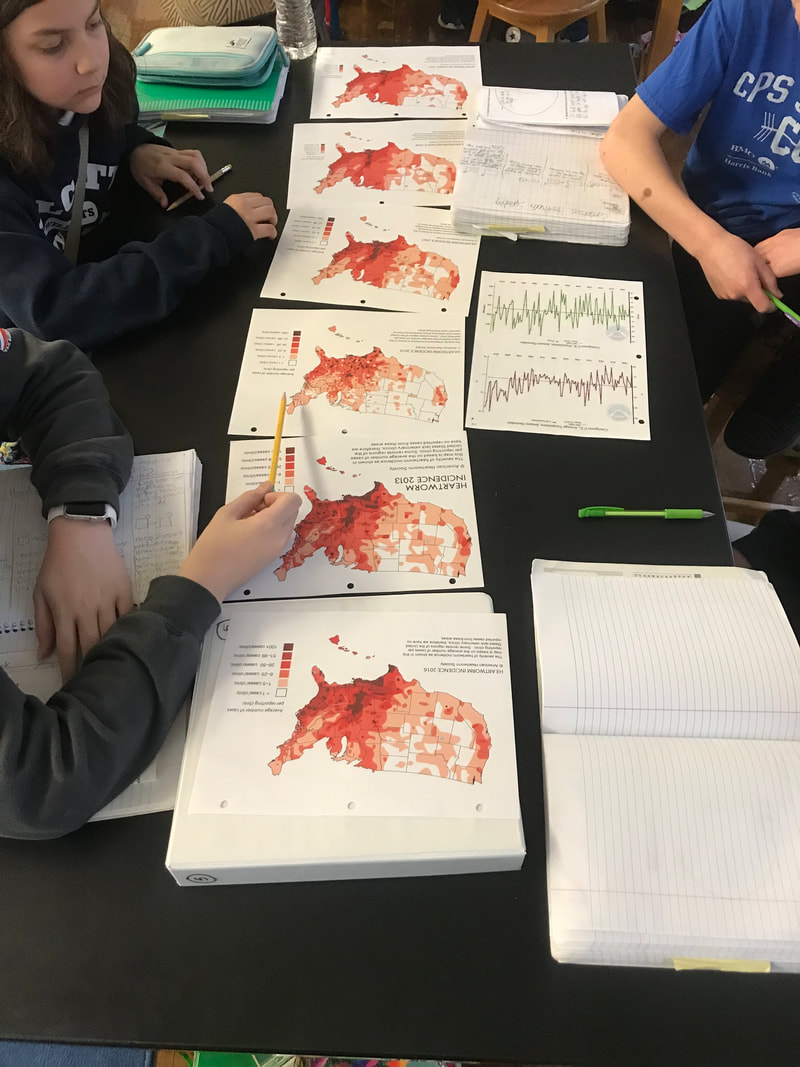
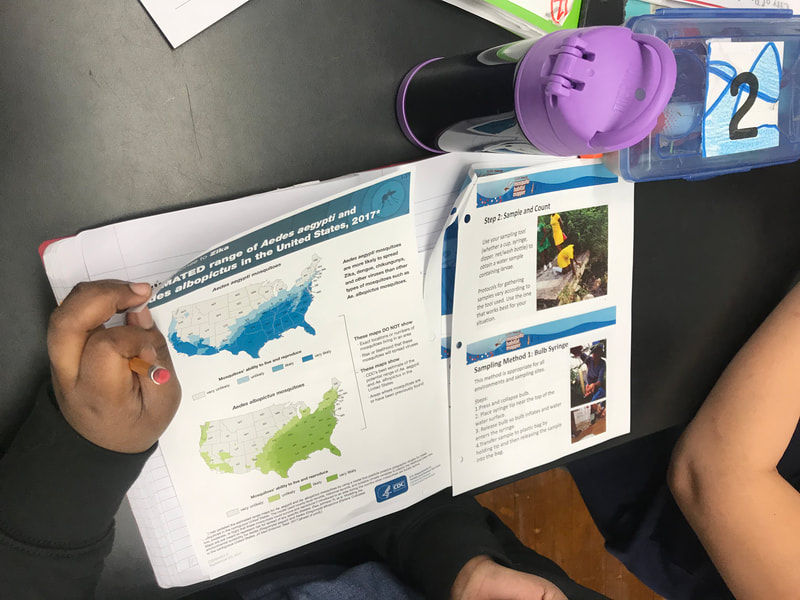
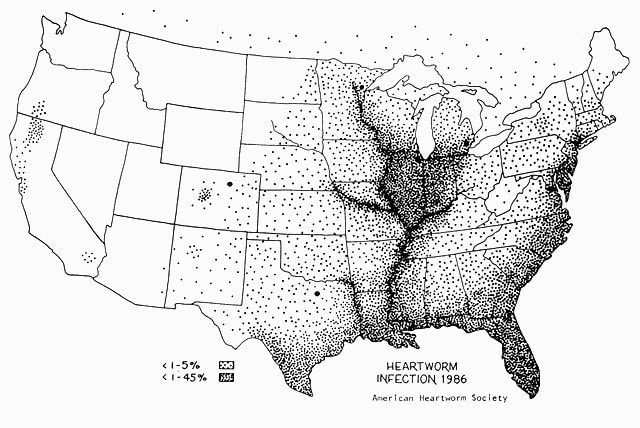
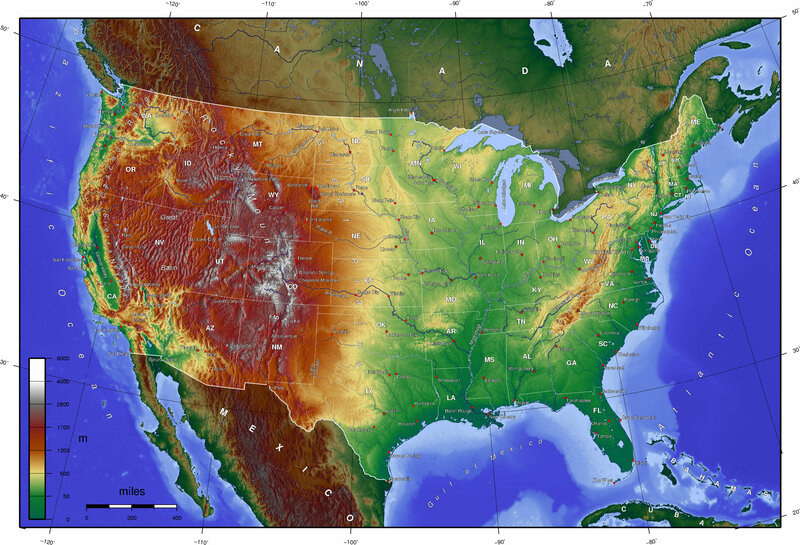
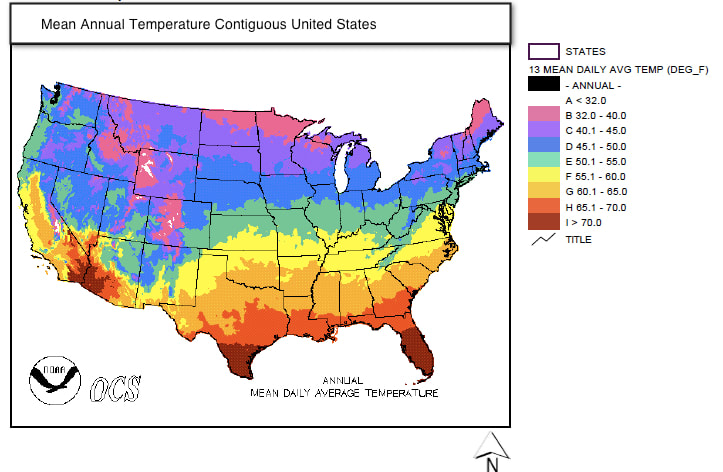
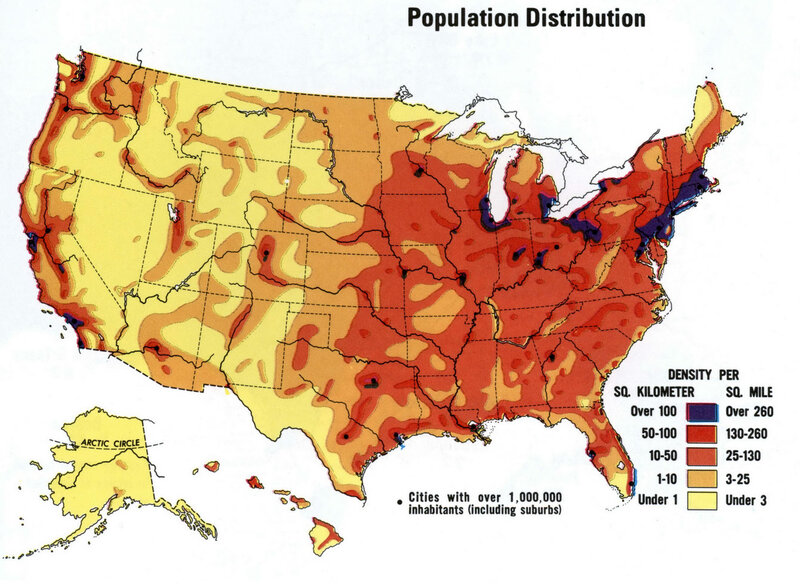
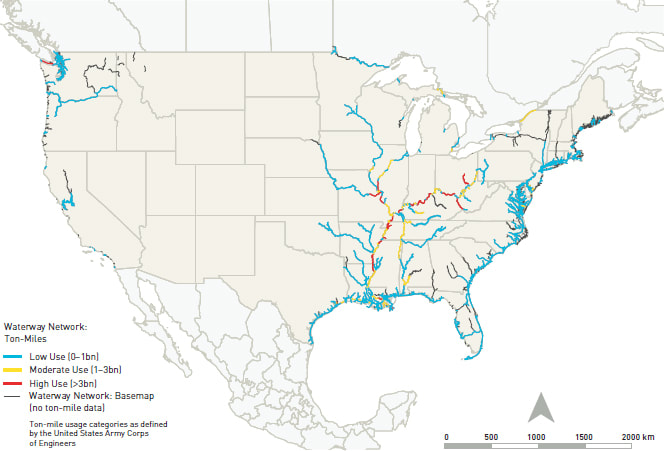
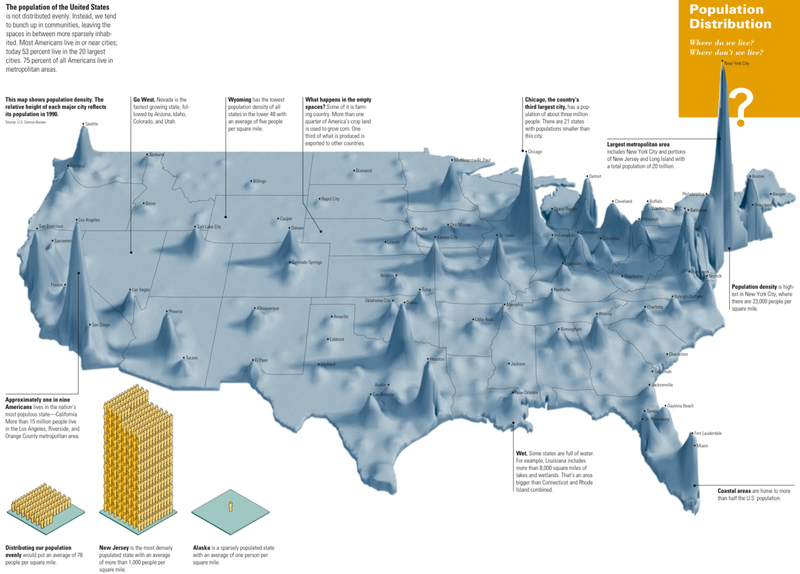
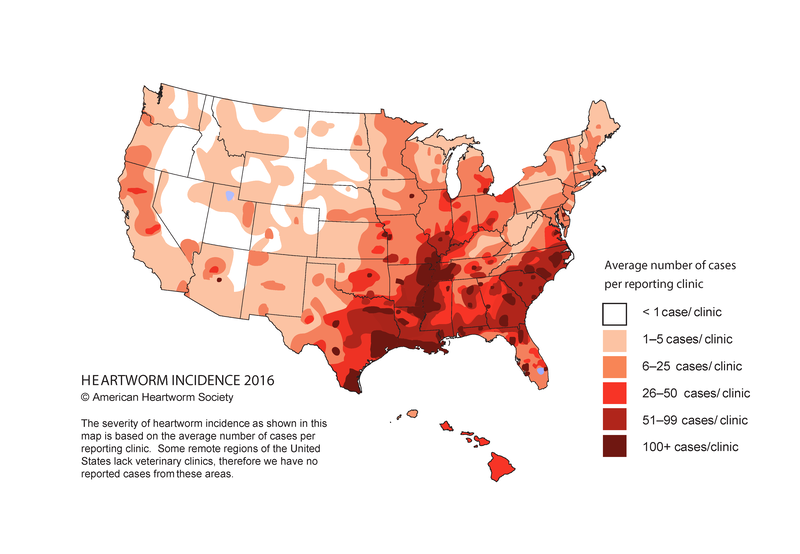
We're back from winter break and digging deeper into figuring out more about how heartworm spreads. We're hoping that if we figure out the history about the spread of heartworm, like if there were more reported cases before Buddy's in 2014, then we can possibly determine other factors that may be influencing the spread of this horrific disease for dogs. Mrs. Brinza was able to find some pretty interesting maps. These maps seem to somehow be related to what we already know about Buddy and how heartworm spreads. We know Buddy is from the coastal area around the Gulf of Mexico, so students wanted some data about what it's like down there. We also know that heartworm is spread through the bite of a mosquito, and that mosquitoes need water (at a specific temperature) to lay their larva. So students now wanted data on water and temperature in the US. And lastly, we've figured out that Buddy is a shelter dog who was adopted after a hurricane too place. We know that dogs will have a more likely chance of being adopted if they are brought to an area that has more people living in it, so students found using population data helpful, too. Here are the maps that students looked at, looking for patterns between the data sets. After looking for patterns, we sat in a scientist circle trying to make sense of all the maps. Here are some patterns that students noticed:
1. Cases of heartworm seem to be prevalent along waterways. We know that mosquitoes need water to reproduce, so this makes sense to us. 2. Areas with lower elevations have more water (water flows downward) and more people. People tend to live near water (It's beautiful to look at a body of water, no? And water is important for commerce, too). 3. Heartworm also had a higher incidence in areas with warmer temperatures, and it seems to be less prevalent in areas that are colder. But this got us wondering... Why are there some places that have more cases of heartworm in 2016 as compared to 1986? What's been happening over time that has created this change? Why are there some places with more heartworm now rather than before? Especially if technology and medicine are advancing? Wouldn't we expect the opposite to happen? How can we figure out these trends over time??? |
Mrs. BrinzaThis unit, with the driving question, "Why are dogs getting sick?" is currently under development with the guidance and support of Processing through the Ages: Global change, Evolution, and Societal well-being (PAGES). PAGES is an ambitious Next Generation Science Standards (NGSS)-aligned curriculum development and K–12 teacher education program at the University of Illinois Urbana-Champaign. Archives
February 2019
Categories |


 RSS Feed