We're back from winter break and digging deeper into figuring out more about how heartworm spreads. We're hoping that if we figure out the history about the spread of heartworm, like if there were more reported cases before Buddy's in 2014, then we can possibly determine other factors that may be influencing the spread of this horrific disease for dogs.
Mrs. Brinza was able to find some pretty interesting maps. These maps seem to somehow be related to what we already know about Buddy and how heartworm spreads.
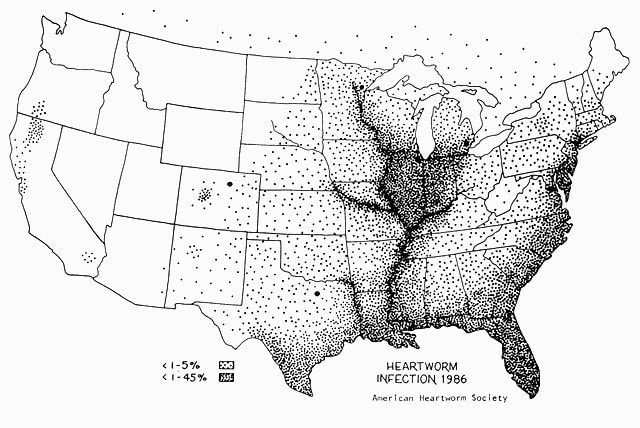
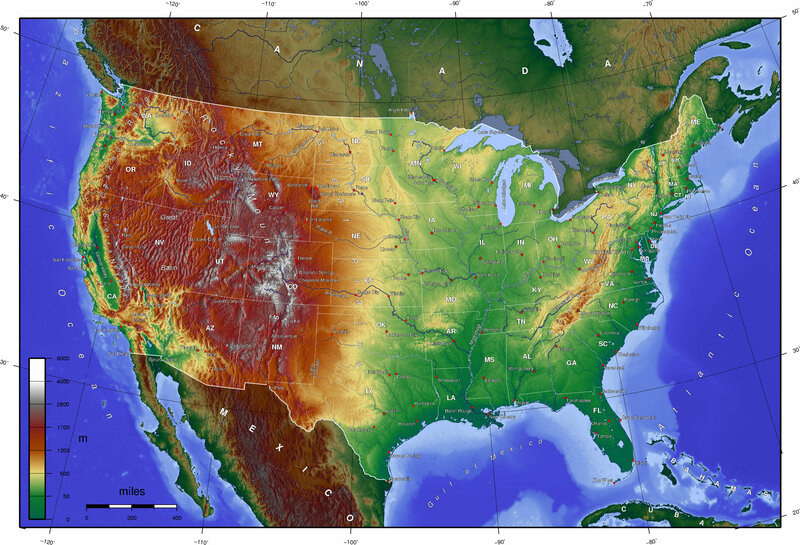
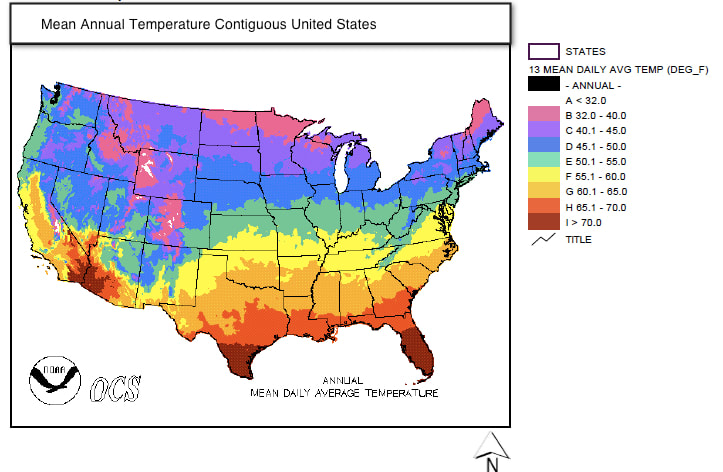
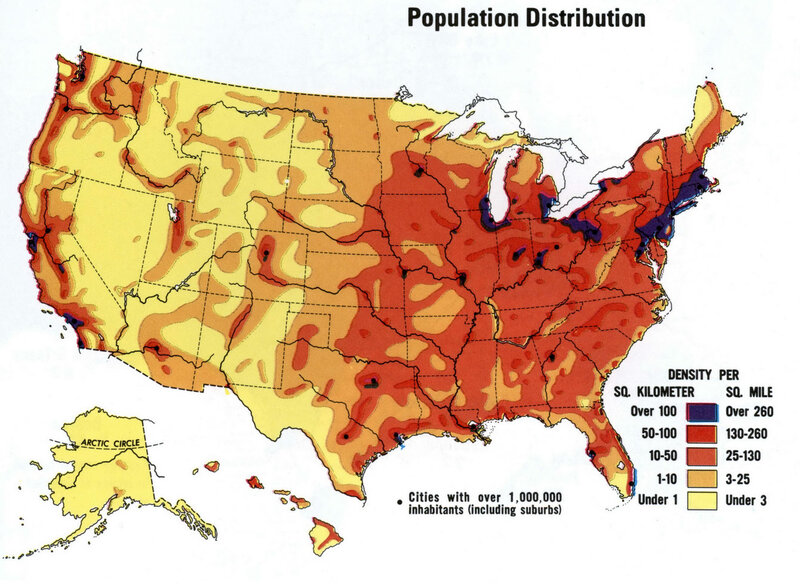
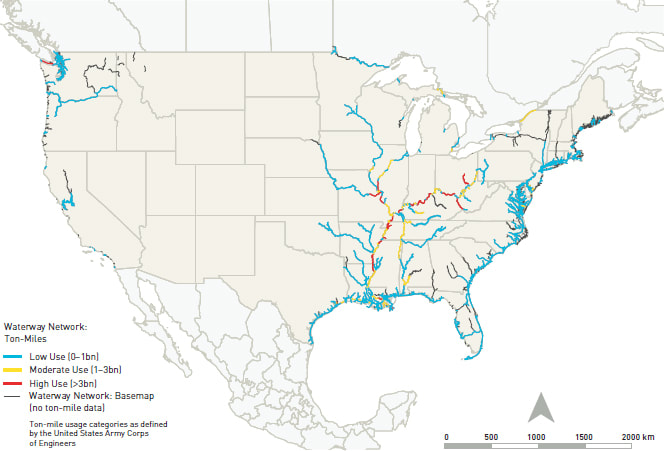
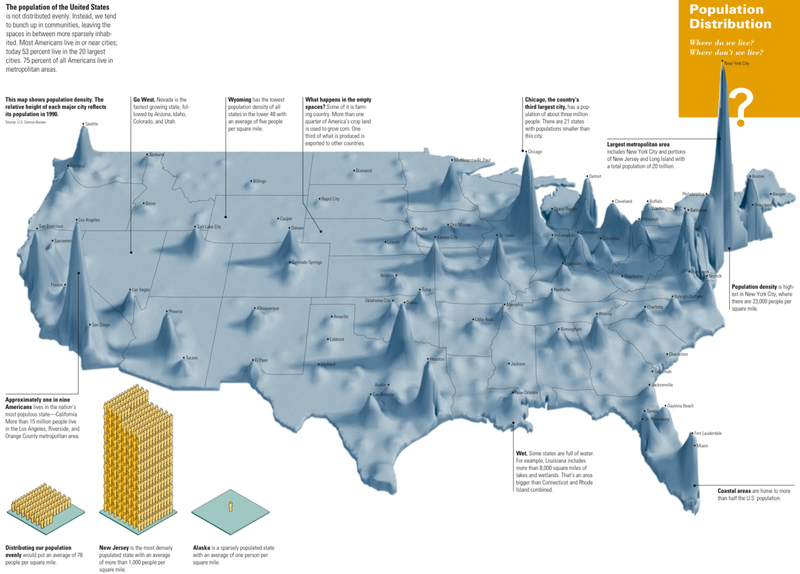
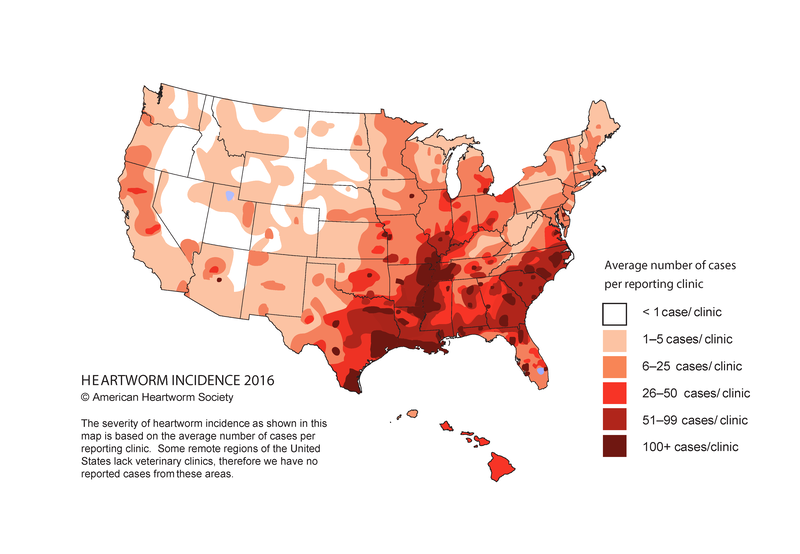
We know Buddy is from the coastal area around the Gulf of Mexico, so students wanted some data about what it's like down there. We also know that heartworm is spread through the bite of a mosquito, and that mosquitoes need water (at a specific temperature) to lay their larva. So students now wanted data on water and temperature in the US. And lastly, we've figured out that Buddy is a shelter dog who was adopted after a hurricane too place. We know that dogs will have a more likely chance of being adopted if they are brought to an area that has more people living in it, so students found using population data helpful, too. Here are the maps that students looked at, looking for patterns between the data sets.
After looking for patterns, we sat in a scientist circle trying to make sense of all the maps. Here are some patterns that students noticed:
1. Cases of heartworm seem to be prevalent along waterways. We know that mosquitoes need water to reproduce, so this makes sense to us.
2. Areas with lower elevations have more water (water flows downward) and more people. People tend to live near water (It's beautiful to look at a body of water, no? And water is important for commerce, too).
3. Heartworm also had a higher incidence in areas with warmer temperatures, and it seems to be less prevalent in areas that are colder.
But this got us wondering...
Why are there some places that have more cases of heartworm in 2016 as compared to 1986? What's been happening over time that has created this change? Why are there some places with more heartworm now rather than before? Especially if technology and medicine are advancing? Wouldn't we expect the opposite to happen?
How can we figure out these trends over time???
 RSS Feed