Gretchen Brinza
Email me!
  • Home
  • About Me
  • School
    • Louisville Middle School >
      • 2022-2023
      • 2021-2022 >
        • 6th Grade: Contact Forces/Collisions!
        • 8th: Patterns in Space and Sky
        • 6th: Bath Bombs
        • 8th: Climate--The Warming Arctic
        • 8th: Hail, Rain & Snow
        • 6th: Cups
        • 8th: Tsunami-Natural Hazards
        • 6th: One-Way Mirror
        • 8th: Mt. Everest & Other Mtns
    • Sauganash >
      • 2020-2021 >
        • 5th Grade >
          • Data in Science
          • Human Impact (+/-)
          • The Dead Raccoon
          • Clean/Dirty Water
          • Opening Routines
        • 6th Grade >
          • Healing
          • A Changing Landscape
          • Keeping Things Hot or Cold!?!?!
          • One-Way Mirror
          • Dogs (Well and Unwell)!
          • Opening Routines
      • 2019-2020 >
        • 5th Grade >
          • The Sky
          • Dead Raccoon
          • All Things Water!
        • 6th Grade >
          • Sick Dog
          • Mt. Everest
          • Cups
    • Alcott >
      • 2018-2019 >
        • 5th Grade >
          • Patterns in the Sky
          • Roadkill--Dead Stuff
          • Down the Drain...
        • 6th Grade >
          • Chickens!
          • Sounds From a Distance
          • Sick Dogs
          • Spooky ________!
      • 2017-2018 >
        • 5th Grade >
          • The Mystery Sun
          • Roadkill
          • Clean/Dirty Water
        • 6th Grade >
          • Changing Populations
          • Smelling Lots of Stuff
          • Seeing and Light
      • 2016-2017 >
        • 6th Grade >
          • Can I Believe My Eyes?
          • How Can I Smell Things From a Distance?
          • Where Have All the Creatures Gone?
        • 5th Grade >
          • Unknown Chemicals' Identities?
          • Data
          • Water Transformations
          • The Raccoon Mystery
        • Technology Integration
      • 2015-2016 >
        • 5th Grade >
          • Opening Procedures
          • Chemical Tests
          • Earth's Systems Science
          • Data (Moon, Daylight, Temp., Constellations)
          • Ships in a Field
          • Patterns
        • 6th Grade >
          • Opening Procedures
          • World of Wonder Projects
          • Can I Believe My Eyes?
          • How Can I Smell From a Distance?
          • Where Have All the Creatures Gone?
    • STEM Magnet Academy >
      • A Glimpse Into My Classroom
      • Fifth Grade >
        • 5th Grade: 2013-2014 >
          • Environmental Engineering (Part II)
          • Aerospace Engineering
      • Fourth Grade >
        • 4th Grade: 2014-2015 >
          • Environmental Engineering
          • Waves and their Applications for Information Transfer
        • 4th Grade: 2013-2014 >
          • Environmental Engineering
          • Transportation Engineering
          • Biomedical Engineering
        • 4th Grade: 2012-2013 >
          • Environmental Engineering
          • Transportation Engineering
          • Biomedical Engineering
      • Third Grade >
        • 3rd Grade: 2014-2015 >
          • Forces and Interactions
        • 3rd Grade: 2013-2014 >
          • Electrical Engineering
          • Acoustical Engineering
          • Optical Engineering
        • 3rd Grade: 2012-2013 >
          • Acoustical Engineering
          • Electrical Engineering
          • Optical Engineering
      • Second Grade >
        • 2nd Grade: 2014-2015 >
          • Geotechnical Engineering
          • Matter and Its Interactions!
        • 2nd Grade: 2012-2013 >
          • Geotechnical Engineering
          • Ocean Engineering
          • Packaging Engineering
        • 2nd Grade: 2013-2014 >
          • Geotechnical Engineering
          • Civil Engineering
          • Ocean Engineering
      • First Grade >
        • 1st Grade: 2014-2015 >
          • Optical Engineering
          • Sound
          • Plants--Structures and Processes
        • 1st Grade: 2013-2014 >
          • Materials Engineering
          • Mechanical Engineering
          • Agricultural Engineering
        • 1st Grade: 2012-2013 >
          • Mechanical Engineering
          • Materials Engineering
          • Agricultural Engineering
      • Kindergarten >
        • Engineers do what?
        • Forces and Interactions!
        • Earth and Human Activity
        • K: 2013-2014 >
          • Introduction to Engineering
          • Force and Motion
          • Fabric
        • K: 2012-2013 >
          • Introduction to Engineering
          • All About Fabric
          • Built By Nature
        • Check it out! >
          • Exciting News
          • National Engineers Week
          • Donations
          • Chicago Events
  • PAEMST
  • Other
    • STEM FAIR 2019
    • STEM Fair 2018
    • Tech-Class
    • Engineering Week
    • G.D.W.O.F.
    • MSU Urban STEM >
      • Summer Work >
        • Ultimate STEM
        • ImagineIT >
          • Phase 1
          • Phase 2
          • Phase 3
        • Deep Play
        • Quickfires
        • Reflections >
          • Summer
        • Cosmos
      • Fall Work >
        • Deep Play Group
        • ImagineIT >
          • Phase 4
          • Phase 5
          • Phase 6
      • Spring Work >
        • Leadership
        • ImagineIT

That's a Wrap!  Dramas in Action!

6/16/2018

 
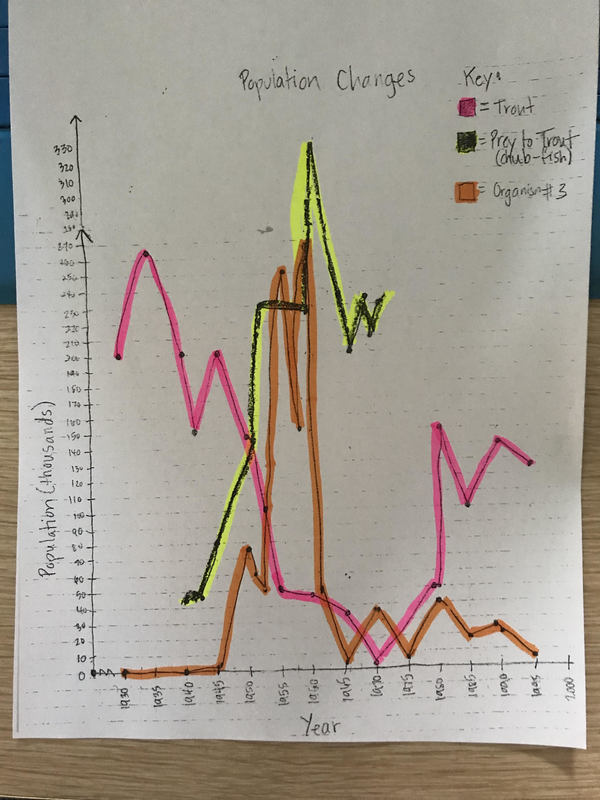
With all their dramas complete and the trout mystery solved, we celebrated the end of our life science unit watching each group perform! Students were required to use props and the shared Google Drawings they made.  Sit back and enjoy!

What a great two years together, sixth grade!  You will certainly be missed!

Dramas 308-Trout Sea-Lamprey - Google Drive

null

FINAL Trout-Sea Lamprey Videos HERE - Google Drive

null

3D Models and Making "Dramas!"

6/7/2018

 
To culminate the ending to our Trout Mystery, students are making 3D models to represent the trout, chub, and sea lamprey along with making dramatic videos to showcase their learning!  Check back soon to see their video-shorts!

Wrapping Up Our Unit

6/5/2018

 
To close out our unit on the mystery behind the changing trout population, students worked in groups to summarize all their learning about the sea lamprey as an invasive species, comparing the trout to the sea lamprey's structures, bioaccumulation of dioxin, and the ways in which humans tried to positively reduce the sea lamprey's effects.  All this work was on top of students completing their final CER to answer the question:

What caused trout populations to change from 1930-1995 in the Great Lakes?  

Visuals 305 Shared Drawing

Table 1's Visuals Table 2's Visuals Table 3's Visuals Table 5's Visuals Table 6's Visuals 305 Visuals for Changing Population Table 4's Visuals Table 7's Visuals

Visuals 308 Shared Drawing

Table 1's Visuals Table 2's Visuals Table 3's Visuals Table 5's Visuals Table 6's Visuals 308 Visuals for Changing Populations Table 4's Visuals Table 7's Visuals

Seeing Human Impact's Role

6/3/2018

 
After finishing our mathematical models, we turned back to the graph.  We recognized that there were two places on our graph that didn't make any sense.  These two instances were when:

1.  The chub, lamprey, and trout populations all plummeted.
2.  The trout population rose, while the sea lamprey population continued to drop.

This got us thinking that there had to be something causing all three organisms to decline, and one thing they all shared in common was the water they lived.  Mrs. Brinza got her hands on some environmental data for a chemical known as dioxin.  Dioxin is a harmful substance released from factories, and it bioaccumulates.  We graphed this data and saw some pretty interesting patterns.
Picture
We learned about bioaccumulation by doing a simulation with an everyday chemical and water, tying in ratios from math to show how just a small amount of a harmful substance can have an impact on water's quality.
We also figured out that human's recognized their impact when many populations of organisms were dying.  Our graph also showed us the positive impact humans were making as they began creating solutions to the sea lamprey and dioxin problems, by regulating water in the Great Lakes, introducing controlling mechanisms to control the lamprey (lampricide, barriers, and sterilization techniques).

Comparing the Two Organisms

5/22/2018

2 Comments

 
We finally cleaned up our room and had a chance to really figure out what our dissections revealed to us. We're still trying to figure out the cause(s) behind the fluctuating trout population, and we feel that we've gotten a handle on things.

But some of the things we figured out about bony fish and the sea lamprey don't really hit home until we look at the evidence mathematically. Since sixth graders have studied ratios and proportions in math, it seemed like a great way to compare these two organisms!  
 
Using research and evidence from the dissections, students created a mathematical model to represent various features of both the trout and the lamprey.  From some of models, it seems like the lamprey totally had an advantage over the trout. In other models, the trout looks overpowering to the sea lamprey.  

Which models best represent the results of an invasive species' effect on an organism in an ecosystem?  You be the judge!
2 Comments

The Real Organisms!

5/15/2018

 
After exploring the simulator and seeing what happens to another invader as it relates to the ecosystem it enters, we're beginning to think that an invader is absolutely organism #3 on our graphs.

But it would be really helpful to see both the trout and sea lamprey in person, to get a first hand account of what these two organisms are like.

Field trips and scuba diving were suggested early on in our unit, and while these ideas are certainly great ways to see these organisms, it's hard to do and risky.

So Mrs. Brinza is bringing the organisms to us!  The trout wasn't available, so we're using another bony fish--the perch, as a comparison.  We'll be looking at both external and internal parts, to compare how these two organisms eat, swim, breathe, and reproduce. 

On Day 1 of our dissection, we looked at the external parts of the bony fish.  
On Day 2, we looked at external parts of the sea lamprey.
Picture
And on Day 3, we looked at the internal parts of both organisms to figure out the most about reproduction.  Look at all those eggs!  

Research and More Data!

5/11/2018

 
So all of our research helped us figure out the following things:

1.  The Great Lakes and the Atlantic Ocean became connected in the 1920s, when canals connected the St. Lawerence Seaway and the Great Lakes.

2.  Around this time, fisherman began noticing large fish, like the trout and salmon, begin to have quarter-sized wounds appear.  They also caught wind of an invasive organism, known as the sea lamprey, to have entered the Great Lakes.  A journal entry from a fisherman in the 1930s revealed this to us.

So we set off to find out more about the sea lamprey, and figured we should compare it to the trout.  We decided to return to our Driving Question Board, and answer questions we had about reproduction, movement, and habitat, for not only the trout, but this new organism, too.
Picture
We discovered a whole bunch of things!

1.  The sea lamprey can live in both fresh and salt water, while the trout can only survive in fresh water.

2.  The sea lamprey have FAR more offspring than a trout.

3.  Despite trout being good swimmers, it seems as if sea lamprey's body made of cartilage and s-like swimming ability make it even faster and more agile than the trout.

4.  The sea lamprey has absolutely no predators, while the trout has many.

While we have lots of strong evidence that organism #3 on our graphs is the sea lamprey, but we're using a computer model to help gather even more evidence for what an invasive does to an ecosystem.  

At the start...

Half way through...

When the invader arrives...

What do you notice when an invasive arrived in this ecosystem?  How is this related to what happened to the trout?  And the trout's prey?
Picture

Wait!  What is going on here?

5/7/2018

0 Comments

 
So we've figured out that organism #2 is prey to the trout.  In fact, it's chub--a smaller fish the trout consumes.

But we got this other organism...organism #3, and after graphing it, we had a lot of concerns.  We immediately couldn't call it a predator or a prey to the trout since it seems to break some "rules" we established about what happens to each type of population in terms of increasing/decreasing.

The most astounding part was what happened between 1930-1945.  For one thing, it didn't exist in 1930--it's total population was ZERO!  We had a lengthy discussion about what this means (extinct versus new species?!?!?!) and clarified that organisms of different species couldn't mate with one another, and that if an organism is extinct it can't come back.  We certainly had lots of wonderings!
This got us to thinking a couple things. Maybe the organism did exist and they just didn't see it?  Someone mentioned that the Great Lakes connect to other bodies of water, and an organism may travel to a new environment to live for lots of reasons--to escape predators, to follow a food source, or possibly create a safe home for their offspring.

So we're off to do two things.  We're going to use a US government map to see what the Great Lakes connect to (via satellite imagery) and research what could have happened historically in the Great Lakes during this unique time period.
Picture
0 Comments

Even More Data

5/4/2018

 
So after some really intense conversation in class, we figured out that our second organism had to be prey to the trout.  While we recognized that while the predator population decreases, the prey population would increase, we also determined that a prey population compared to a prey's population would always be larger.  This is because a predator must consume more prey to get the matter and energy it needs.

From there, we looked at the graph to realize that the trout always had enough food to consume, yet its population continued to plummet in 1970.  This drove us to consider that prey's availability could NOT be the reason for the trout's decline.

The request for MORE data set in...

And lo and behold, Mrs. Brinza got another set of data.

But what does this data reveal?  What new questions arise?
Picture

Developing Models: Recommending More Data!

4/27/2018

 
From all of our questions on the DQB, students agreed unanimously that we needed to figure out what the trout eats and what eats the trout.  If we could figure out predator-prey relationships with the trout, then we could research population sizes of these organisms and see if there were any correlations to both the rising and falling trout population. 

Each pair of students researched both predators and prey of the trout in the Great Lakes.  From there, students developed models to explain how these organisms could affect the trout.  And since we don't know who could be causing the fluctuations, students recommended an organism to find specific data on!

Trout Predator-Prey Models/Recommendations 305

Trout Predator/Prey Models What population data should we research next? 6th Grade, Room 305

Trout Predator-Prey Models/Recommendations 308

Trout Predator/Prey Models What population data should we research next? 6th Grade, Room 308

Mrs. Brinza then took student recommendations to search for data.  She found data on an organism that was connected to the trout, and we used the data to build this graph:
Picture
And because we've already figured out this:
Picture
It's safe to say that organism #2 must be prey to the trout!  So what? What does this really mean for the trout?!?!?!
<<Previous

    Mrs. Brinza

    When you think about how a population changes, you might not care.  But maybe you really should, because it actually may​ affect you!

    Archives

    June 2018
    May 2018
    April 2018

    Categories

    All

    RSS Feed

Proudly powered by Weebly