From all of our questions on the DQB, students agreed unanimously that we needed to figure out what the trout eats and what eats the trout. If we could figure out predator-prey relationships with the trout, then we could research population sizes of these organisms and see if there were any correlations to both the rising and falling trout population.
Each pair of students researched both predators and prey of the trout in the Great Lakes. From there, students developed models to explain how these organisms could affect the trout. And since we don't know who could be causing the fluctuations, students recommended an organism to find specific data on!
Each pair of students researched both predators and prey of the trout in the Great Lakes. From there, students developed models to explain how these organisms could affect the trout. And since we don't know who could be causing the fluctuations, students recommended an organism to find specific data on!
|
|
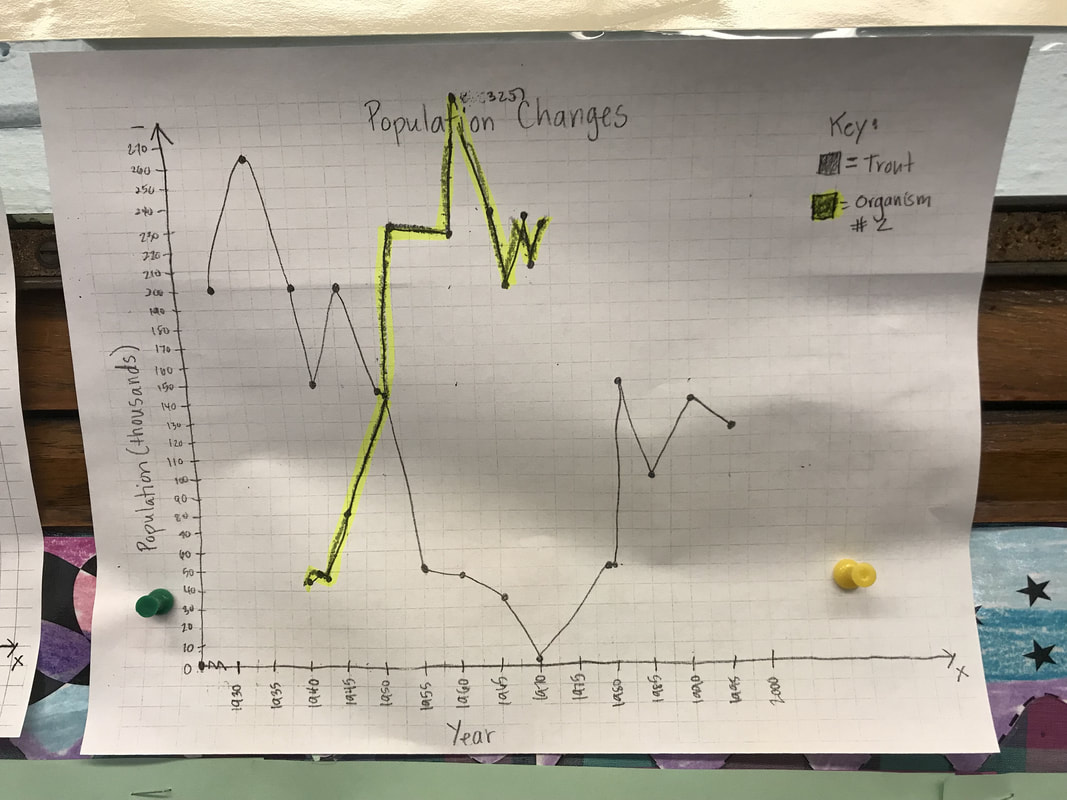
Mrs. Brinza then took student recommendations to search for data. She found data on an organism that was connected to the trout, and we used the data to build this graph:
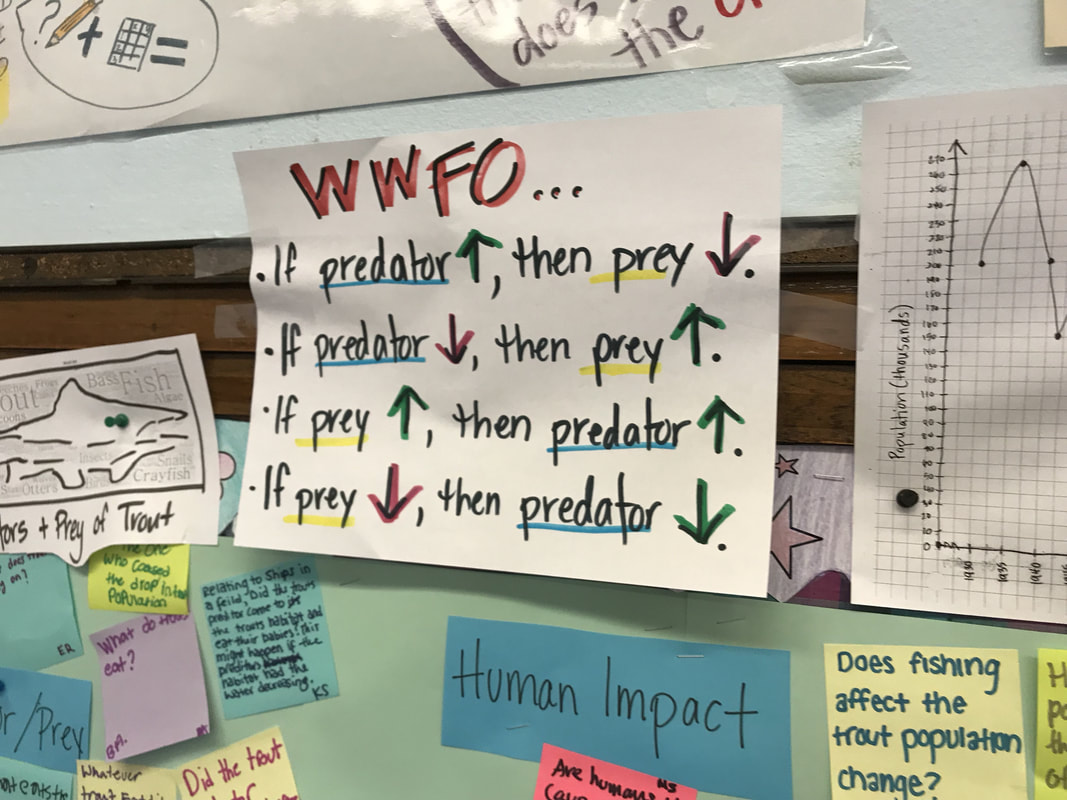
And because we've already figured out this:
It's safe to say that organism #2 must be prey to the trout! So what? What does this really mean for the trout?!?!?!


 RSS Feed