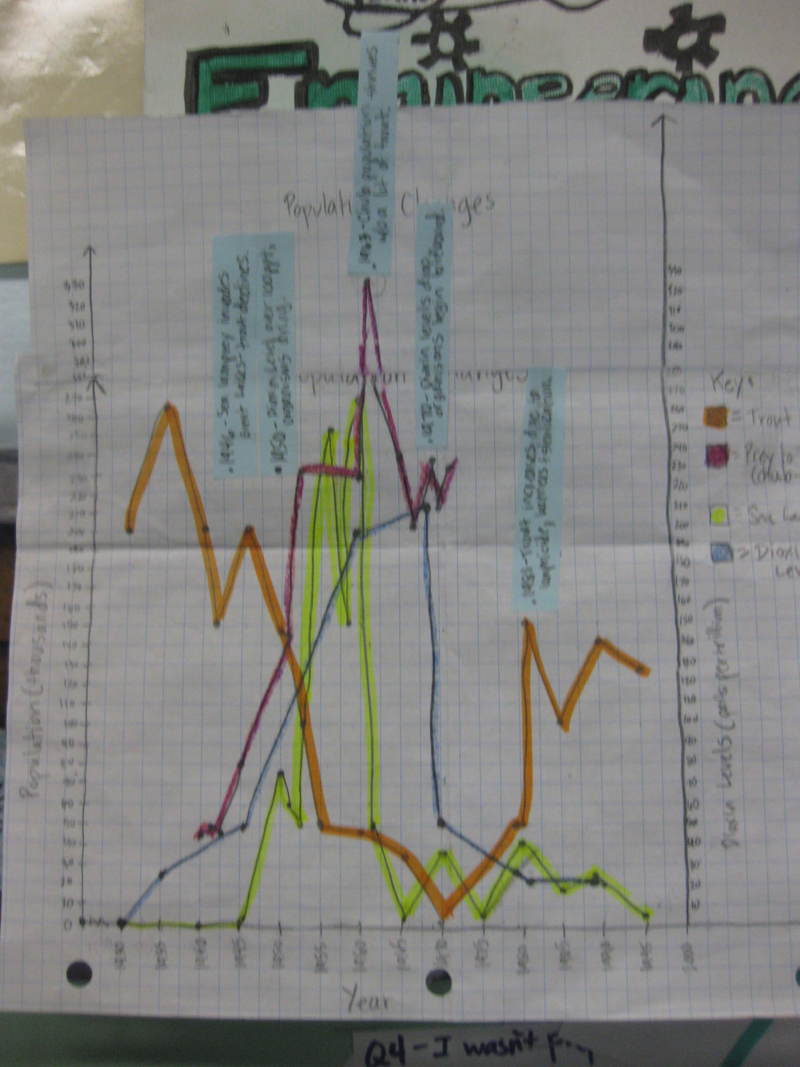
After finishing our mathematical models, we turned back to the graph. We recognized that there were two places on our graph that didn't make any sense. These two instances were when:
1. The chub, lamprey, and trout populations all plummeted.
2. The trout population rose, while the sea lamprey population continued to drop.
This got us thinking that there had to be something causing all three organisms to decline, and one thing they all shared in common was the water they lived. Mrs. Brinza got her hands on some environmental data for a chemical known as dioxin. Dioxin is a harmful substance released from factories, and it bioaccumulates. We graphed this data and saw some pretty interesting patterns.
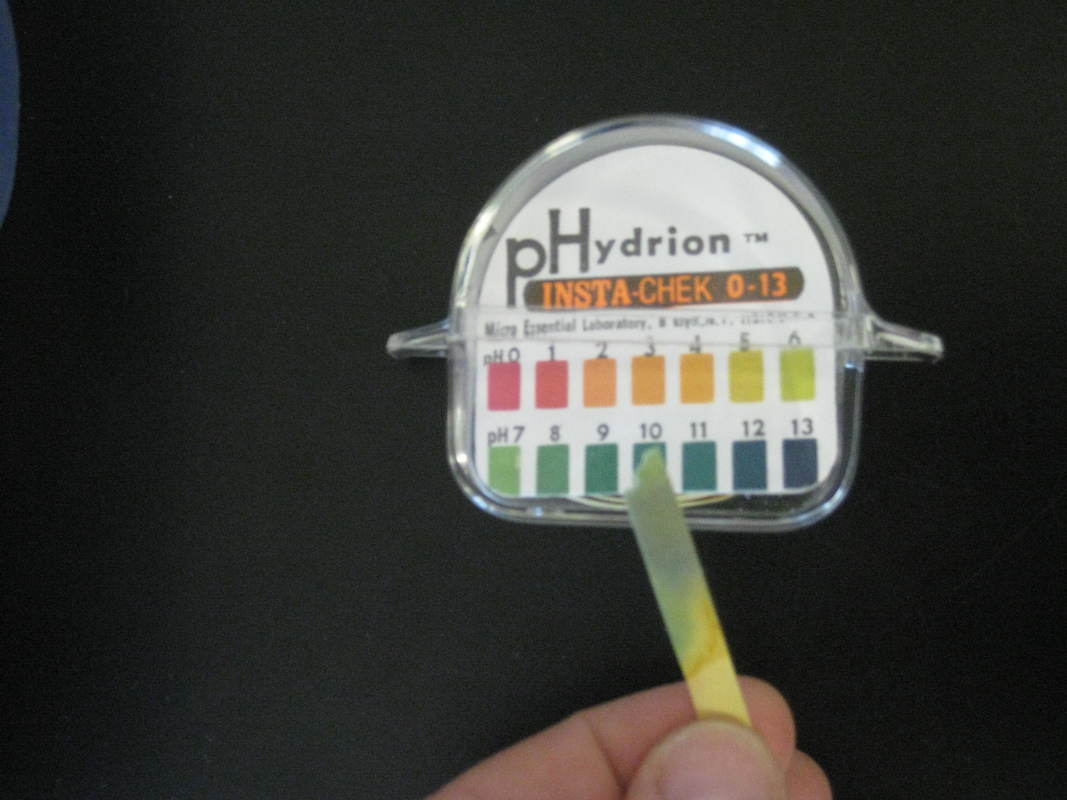
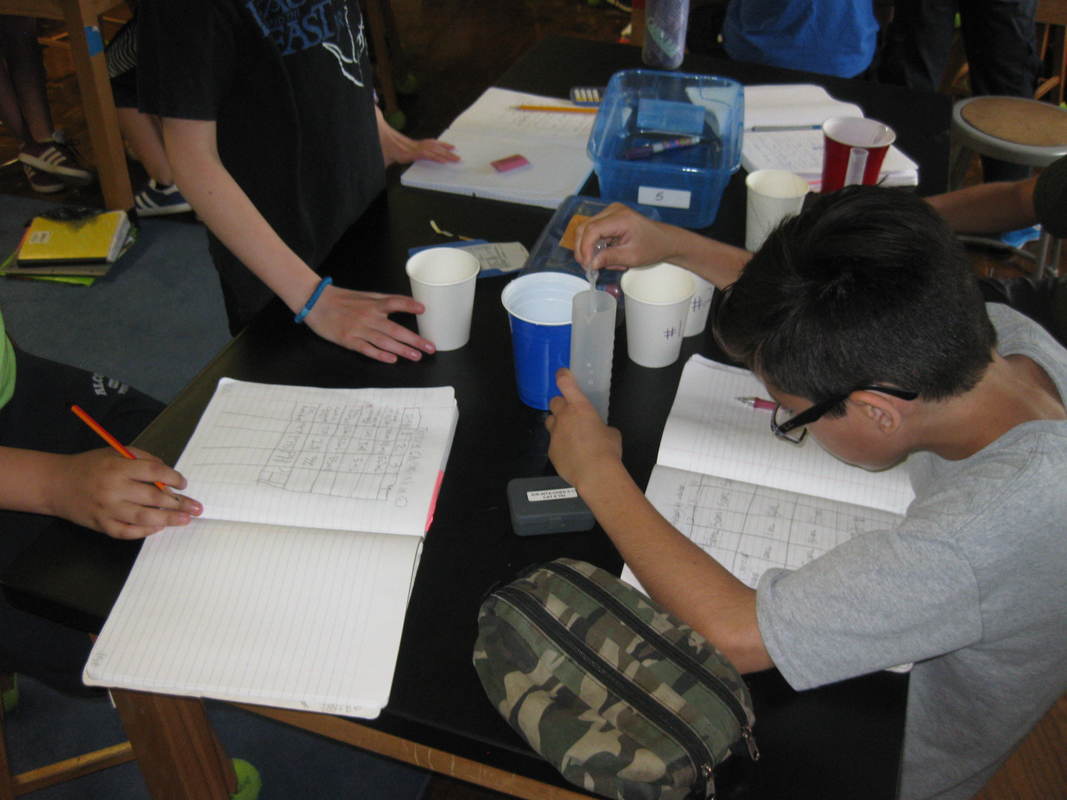
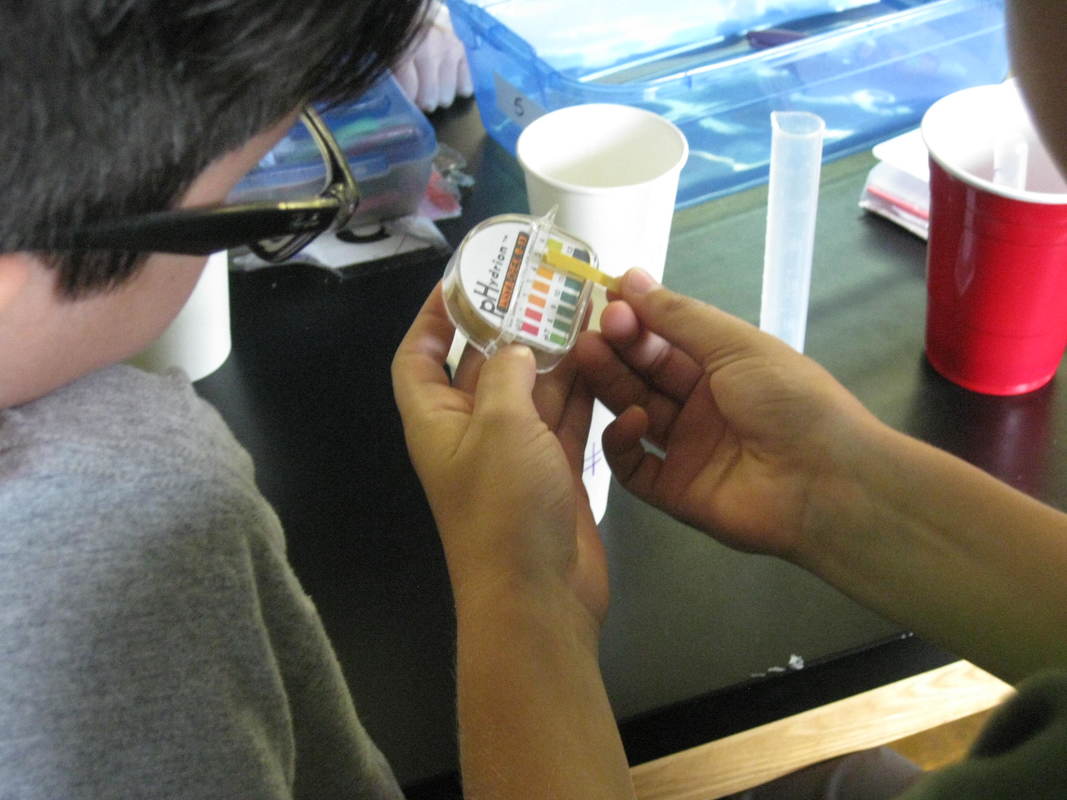
We learned about bioaccumulation by doing a simulation with an everyday chemical and water, tying in ratios from math to show how just a small amount of a harmful substance can have an impact on water's quality.

We also figured out that human's recognized their impact when many populations of organisms were dying. Our graph also showed us the positive impact humans were making as they began creating solutions to the sea lamprey and dioxin problems, by regulating water in the Great Lakes, introducing controlling mechanisms to control the lamprey (lampricide, barriers, and sterilization techniques).
 RSS Feed