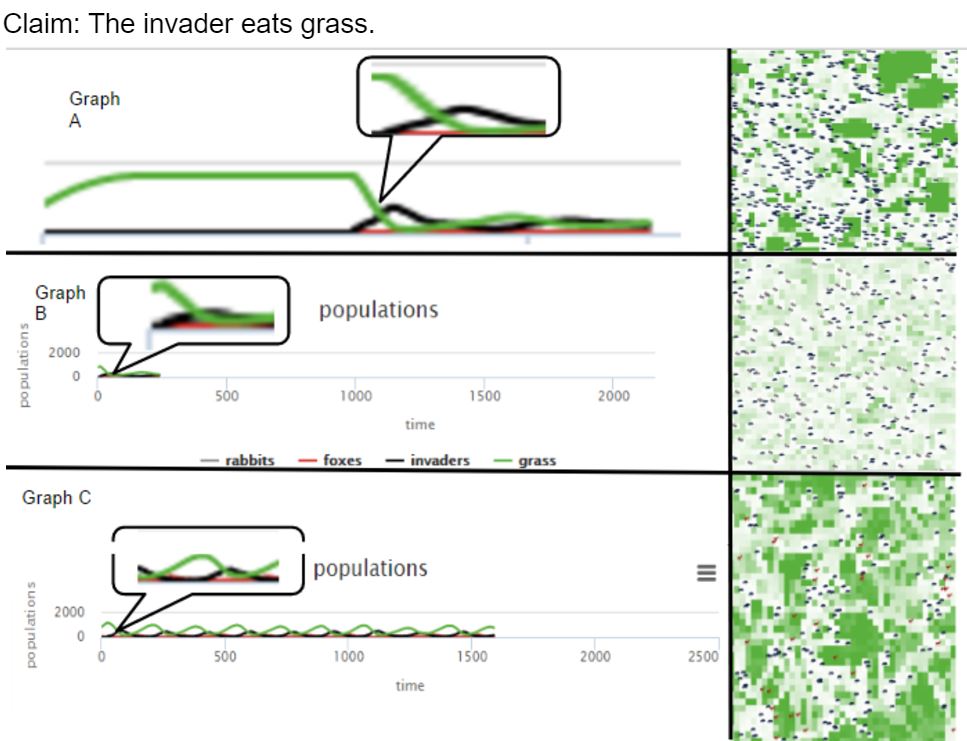
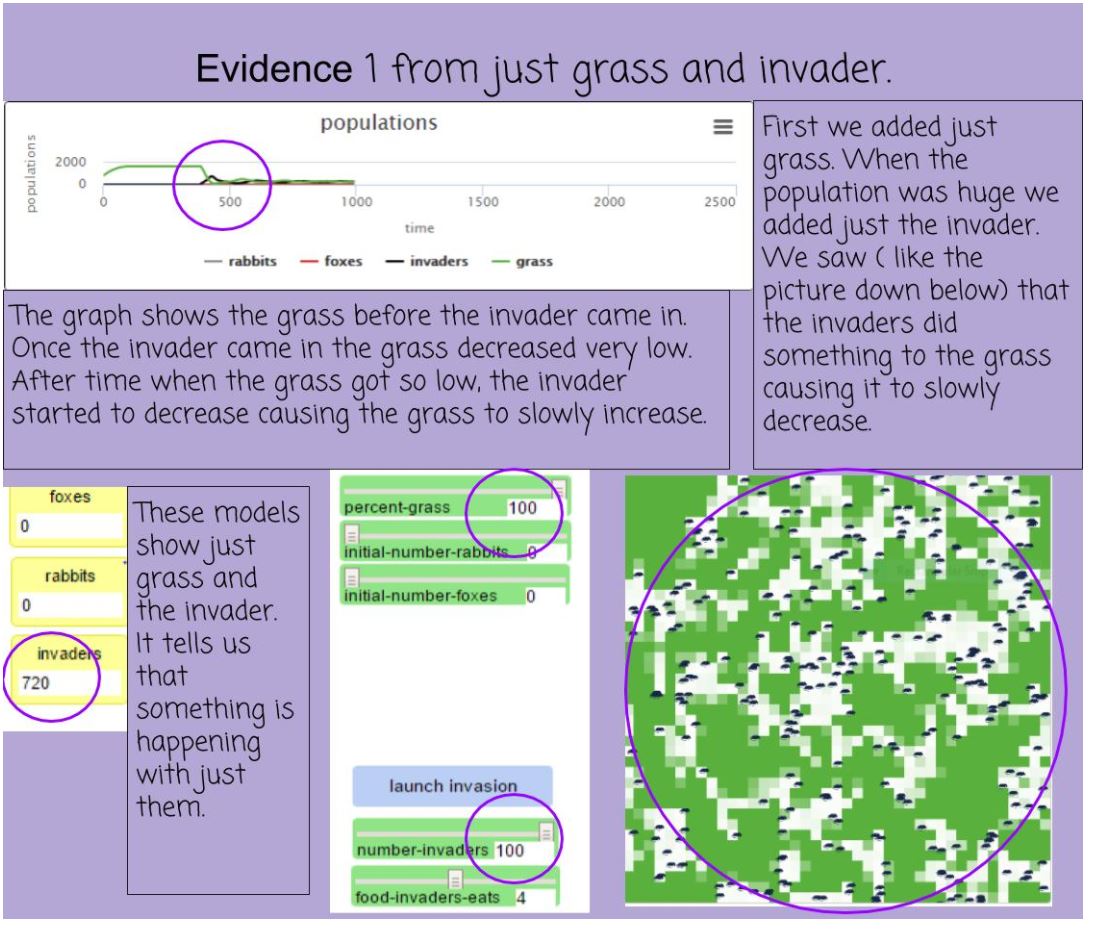

Using the computer model to simulate an invasive and the effects that its arrival has on a stable ecosystem, students determined what an invader ate. They used the graphs and the data to see how populations of organisms fluctuated over time and how competition between organisms affected population size, too!
Students then took to Google Drawing to make their evidence that much clearer to the reader. Check out the three examples of the evidence they collected above. Way to go sixth grade!
Students then took to Google Drawing to make their evidence that much clearer to the reader. Check out the three examples of the evidence they collected above. Way to go sixth grade!
 RSS Feed