Early in our unit, students created a list of investigation ideas, and most recently, we decided to revisit them as our table/laser/drum experiment wasn't all that we hoped it would be. Mrs. Brinza got her hands on a device that tracks motion and displays it in a graph. Since we kept hearing each other say, "Vibrations cause things to move back and forth, back and forth," this seemed like a good place to start.
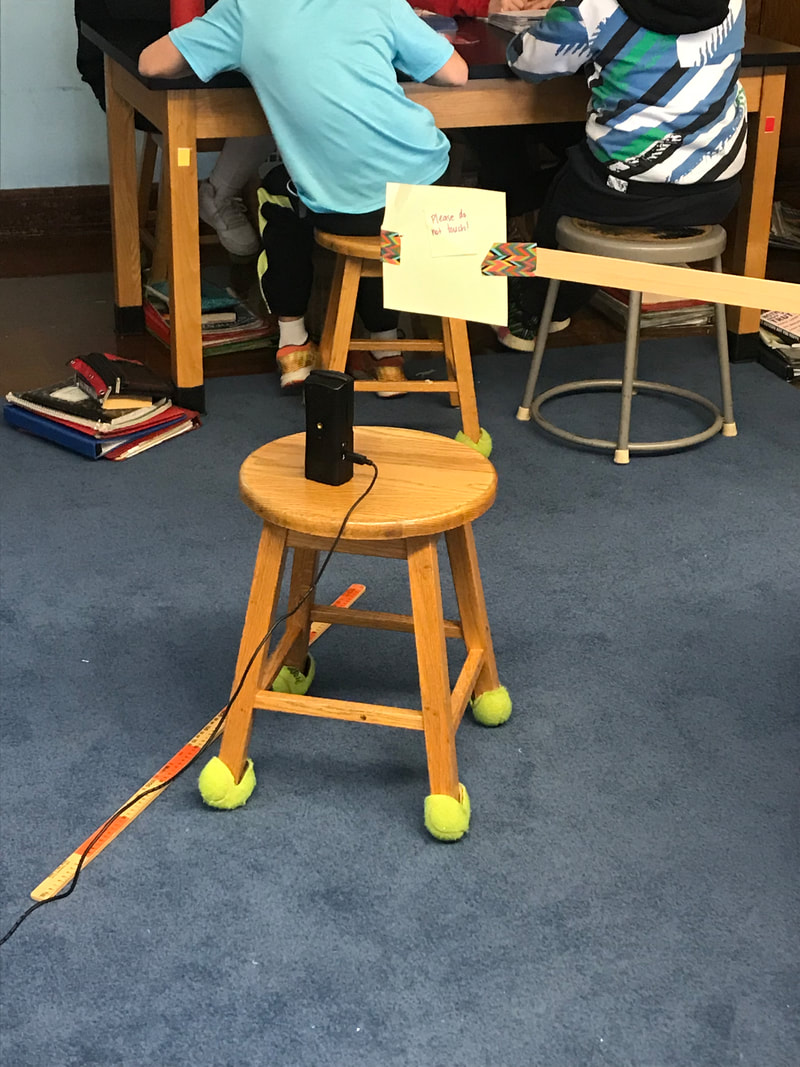


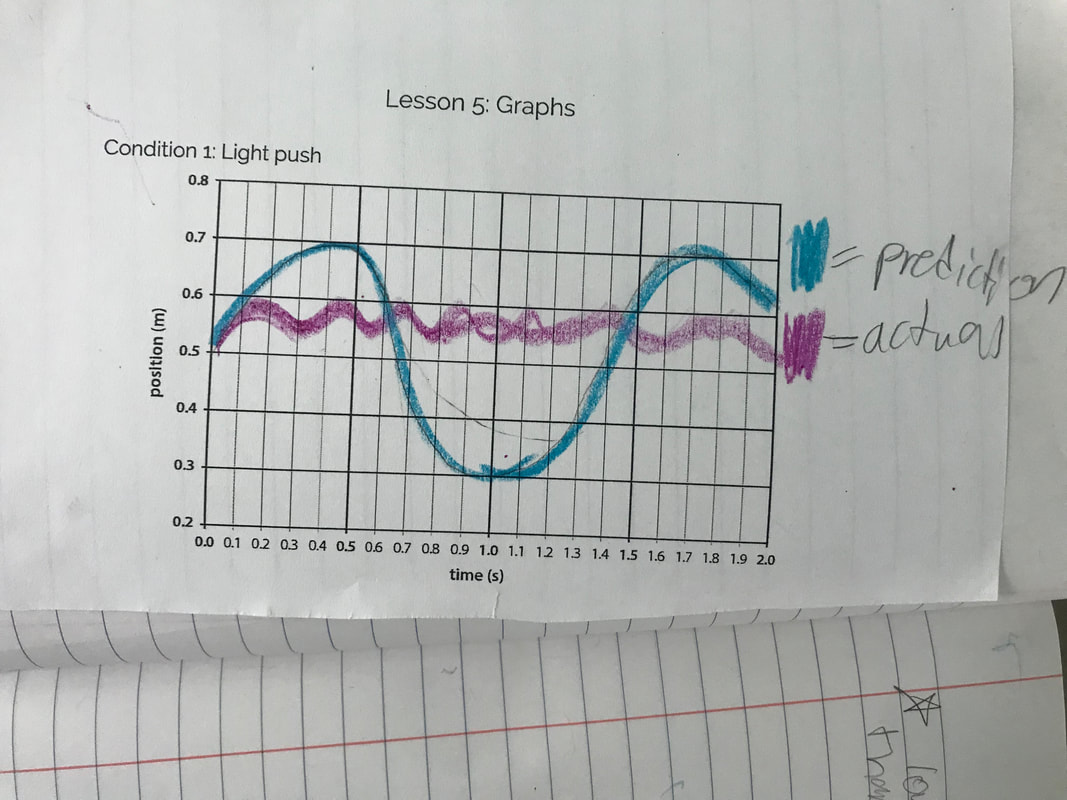
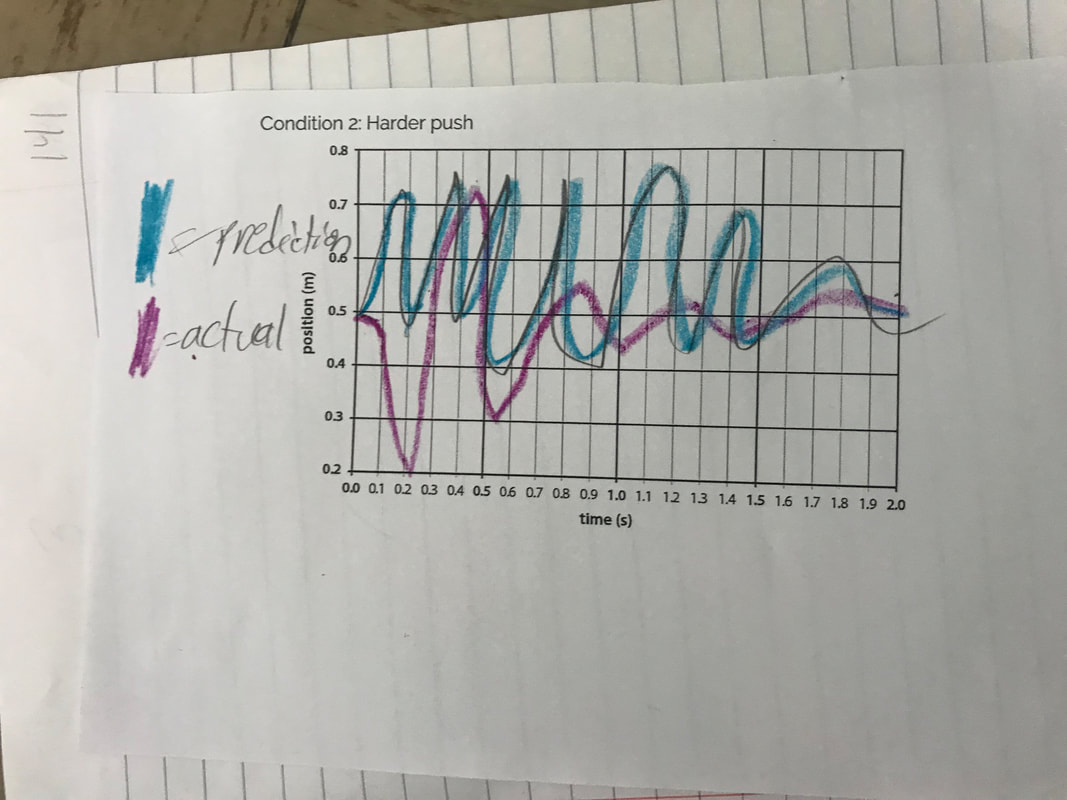
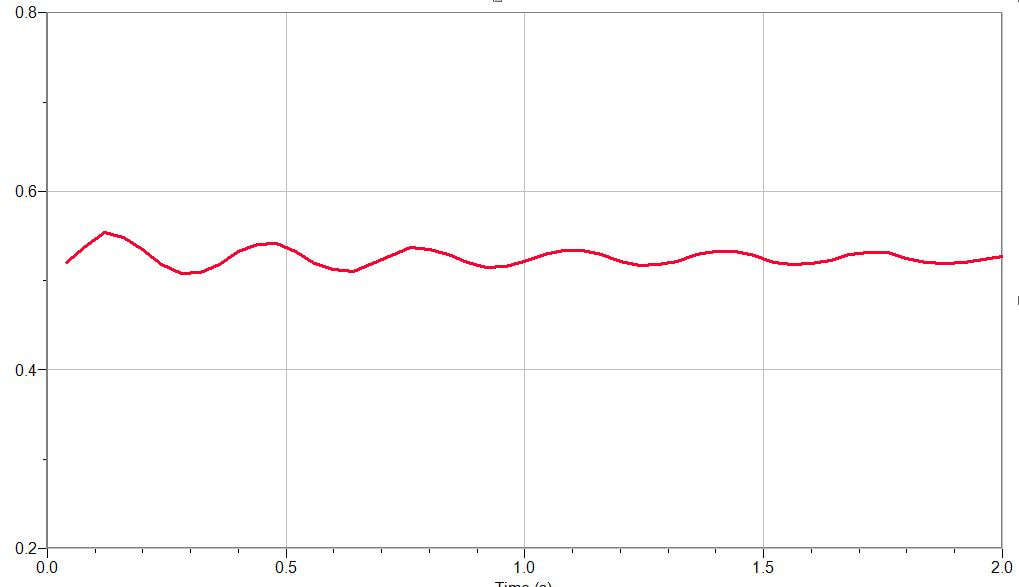
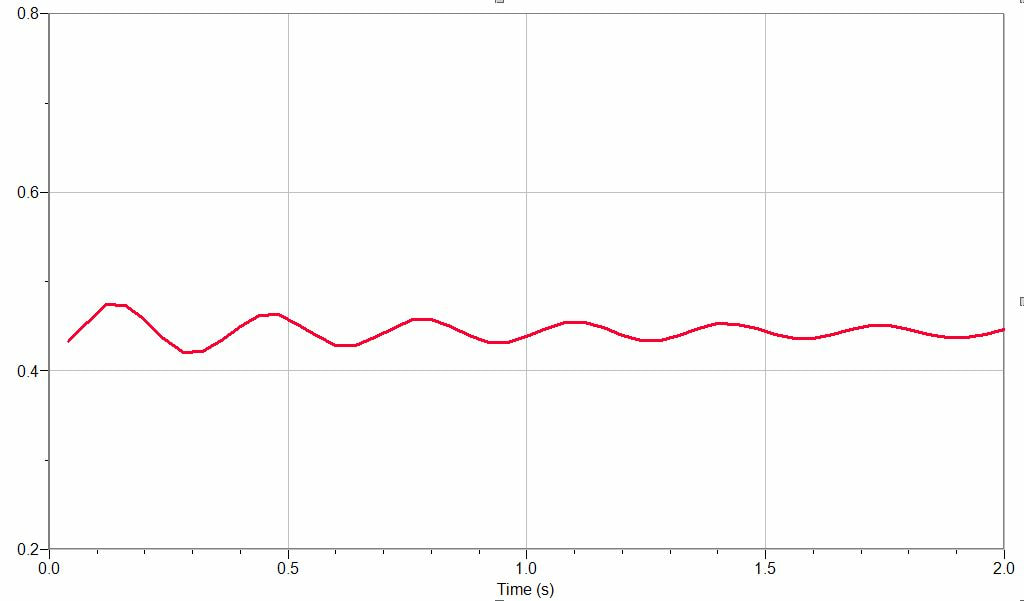
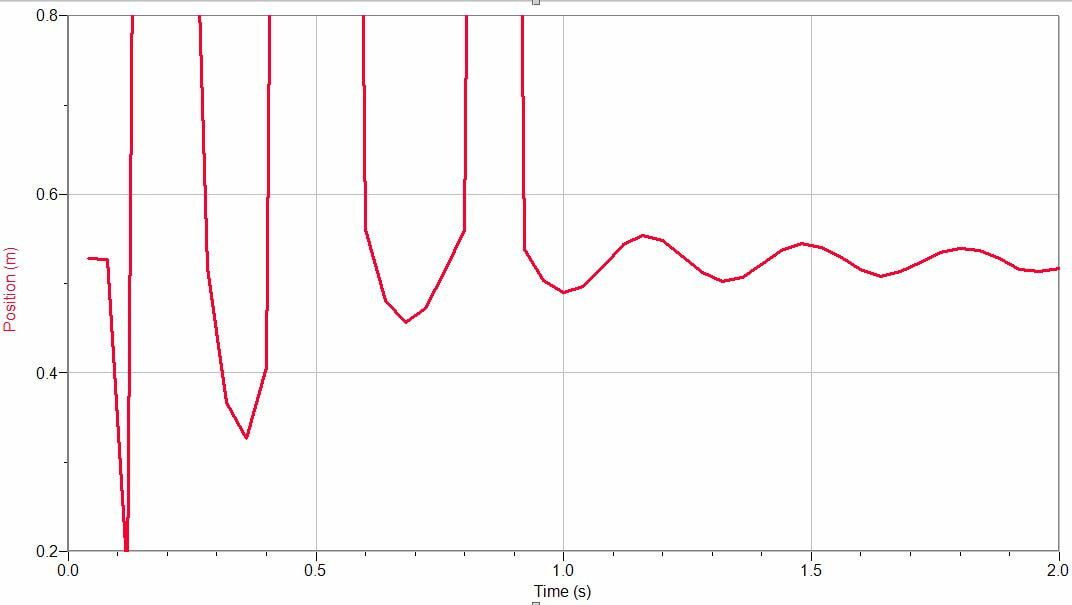
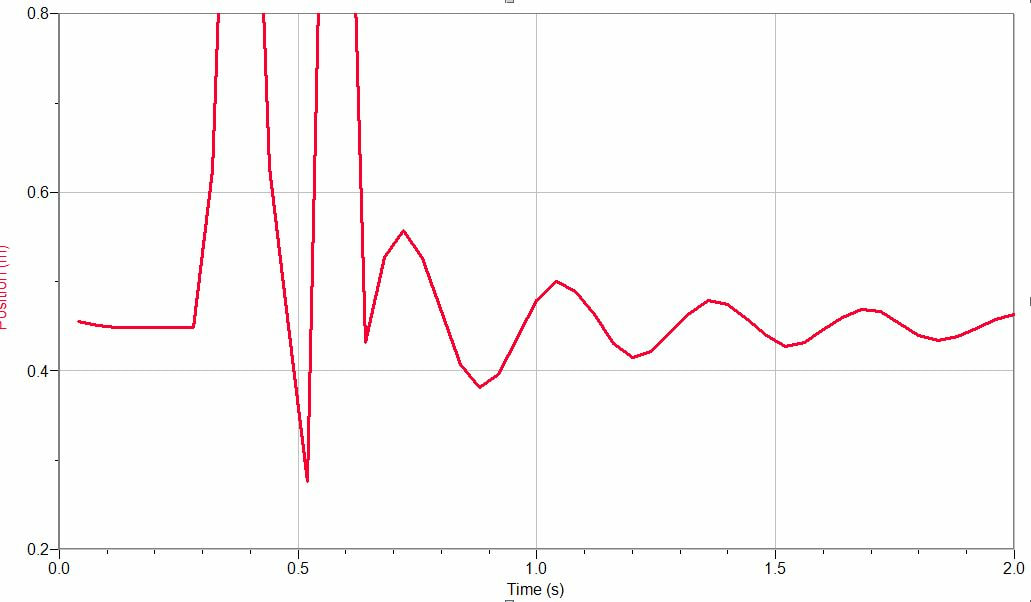
We set up the motion tracker to be in front of a wooden stick (made of pine) and we ran the tracker after we hit the stick with both a gentle and a hard push. We saw the differences in the graph.
"But how is this relating back to sound?"
One student responded with, "We saw the light do things on the ceiling yesterday, like when we beat the drum hard we saw big jumps in the light, moving bigger distances. When we beat the drum softly, we saw barely any jumps in the light. This makes me things that louder sound make taller waves and softer sounds make shorter waves."
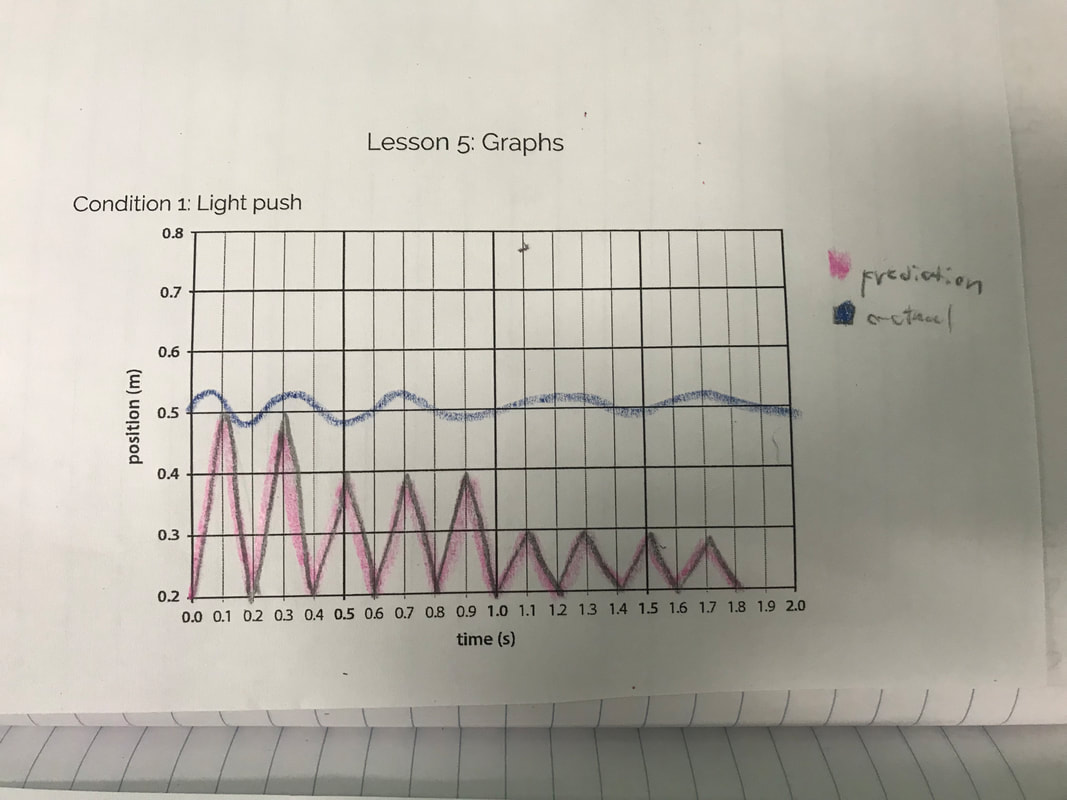
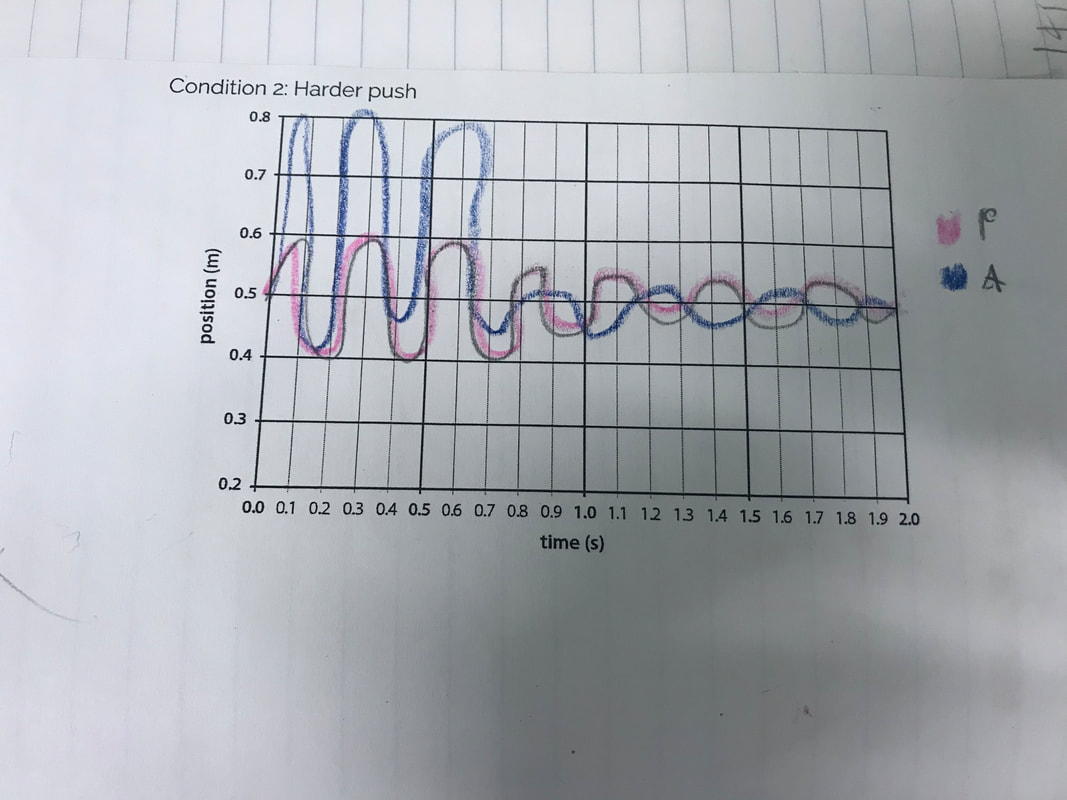
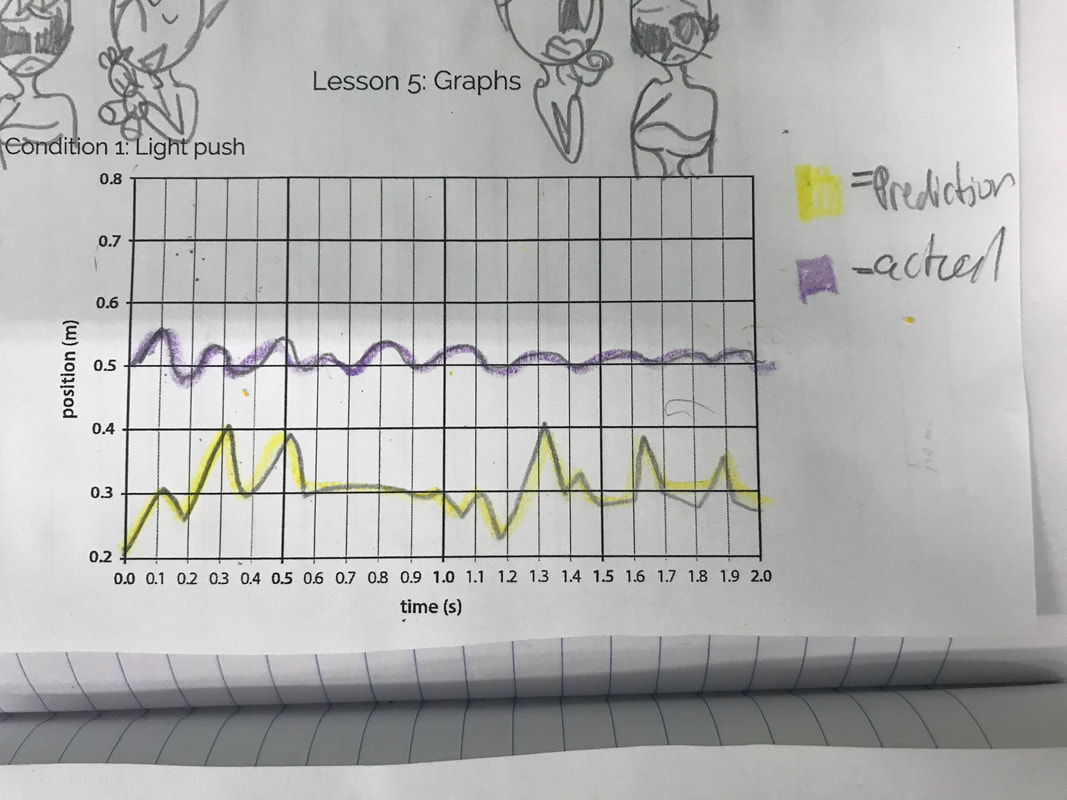
Well said, 6th grader. Here are pictures of the actual data we collected over two 6th grade classes.
"But how is this relating back to sound?"
One student responded with, "We saw the light do things on the ceiling yesterday, like when we beat the drum hard we saw big jumps in the light, moving bigger distances. When we beat the drum softly, we saw barely any jumps in the light. This makes me things that louder sound make taller waves and softer sounds make shorter waves."
Well said, 6th grader. Here are pictures of the actual data we collected over two 6th grade classes.
What would graphs of actual sounds of different volumes look like for us to compare to our motion graphs? Hmmm.....great idea!
 RSS Feed