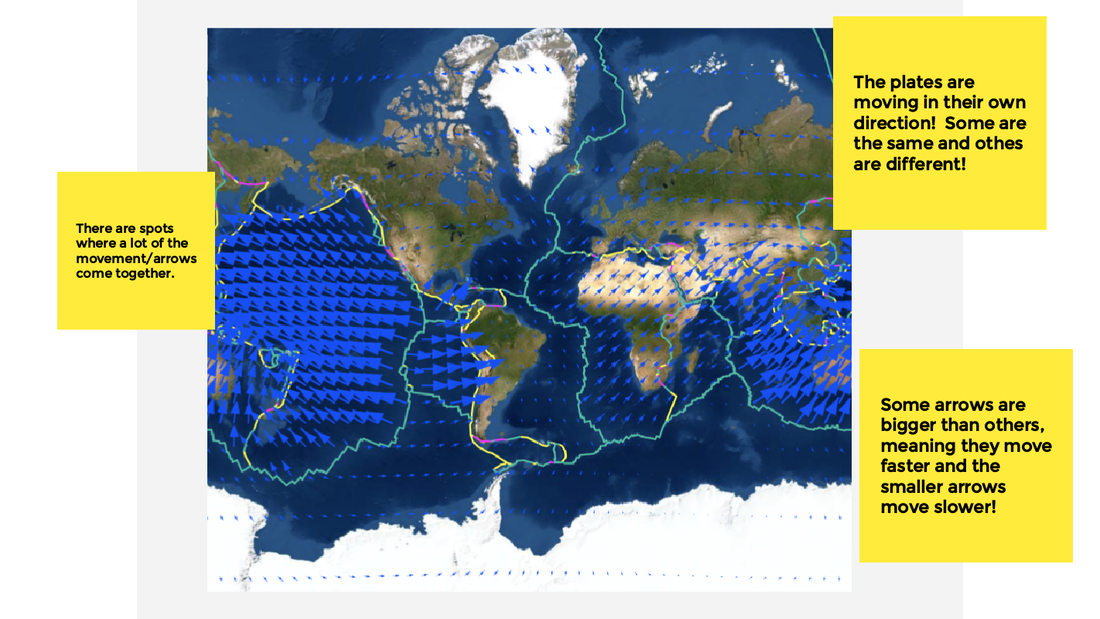
So if we see a changing landscape, we're really wondering about how these plates are moving! We have specific data on various locations--like how many centimeters it moves each year and the direction it goes. When looking at an entire plate boundary map with this data added to it, we saw some incredible things!

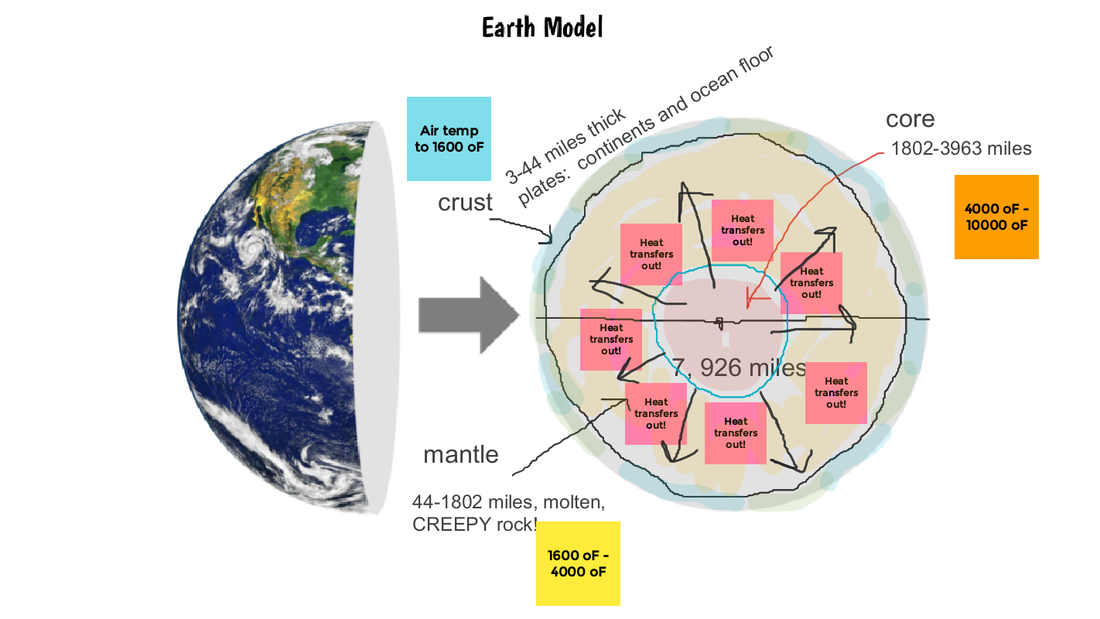
Putting some pieces together, we realized we wanted more information on where these HUGE plates were getting their energy from to move. So we turned to an article that helped us collectively model what's going on if you were to dig past the deepest mine!
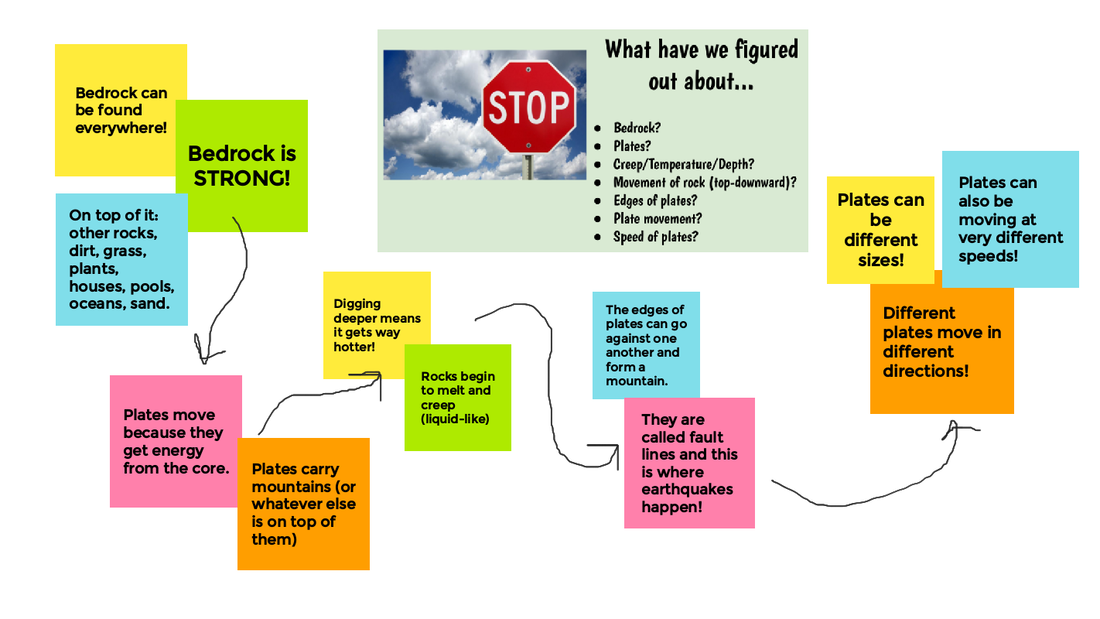
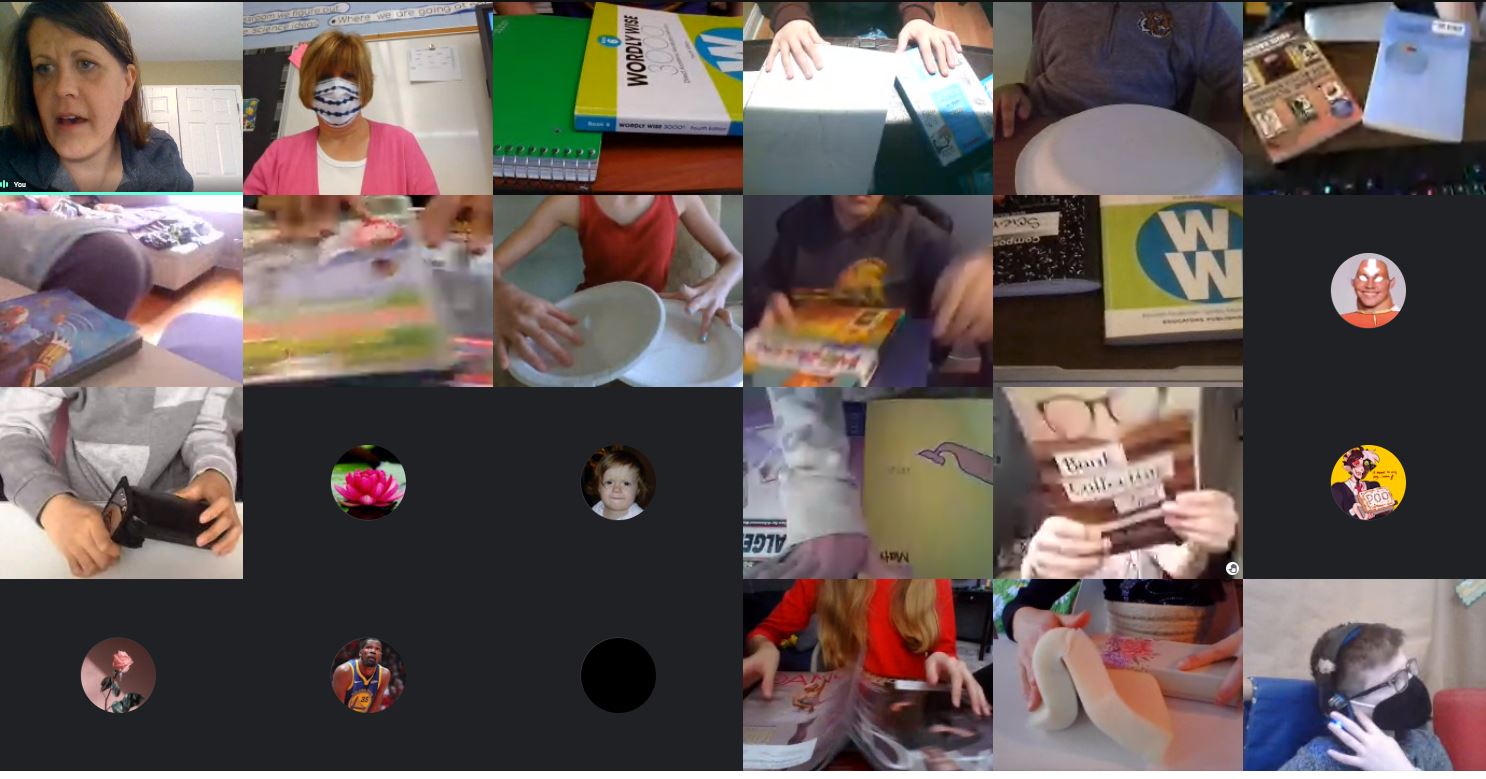
Creating a summary chart, we are seeing how when different plates, which are made of different materials, move in different directions at different speeds, we're bound to end up with something happening on top of the plates--whether that be sediments, plant life, water, or continuous bedrock in a mountain! We took whatever we had around us in the classroom or in our learning spaces remotely to see what we saw on the map...plates coming towards one another, plates sliding past one another, and plates moving apart from one another.
We saw rock that was bending before it broke, plates slipping on top/under one another, big shifts or even high raises in the plates. We realized there were some drawbacks to what we were using, but we're starting to see how the various movements of these plates is causing some interesting patterns on the surface. How can we use these ideas to explain what's happening on Everest and each of our other locations that experience earthquakes, too? We've got more figuring out to do!
 RSS Feed